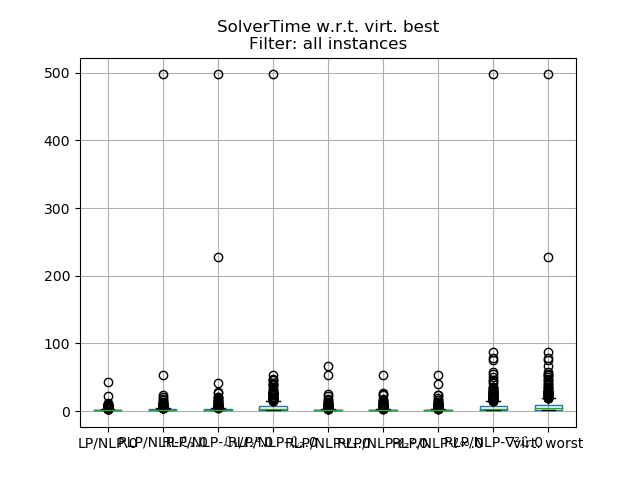
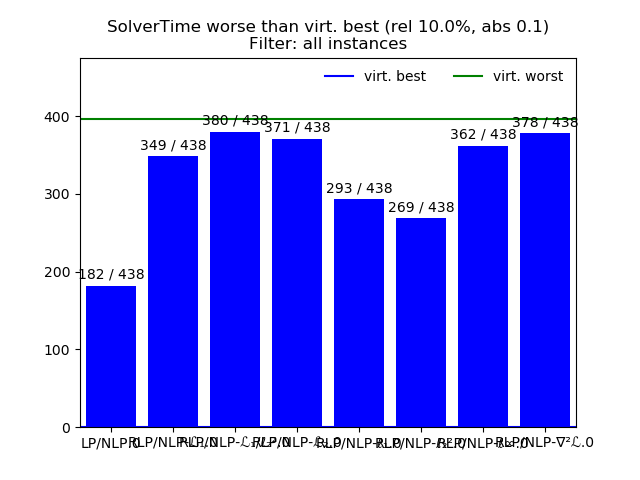
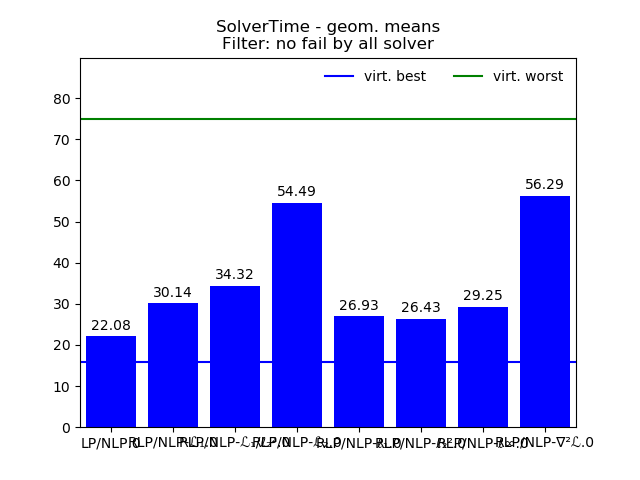
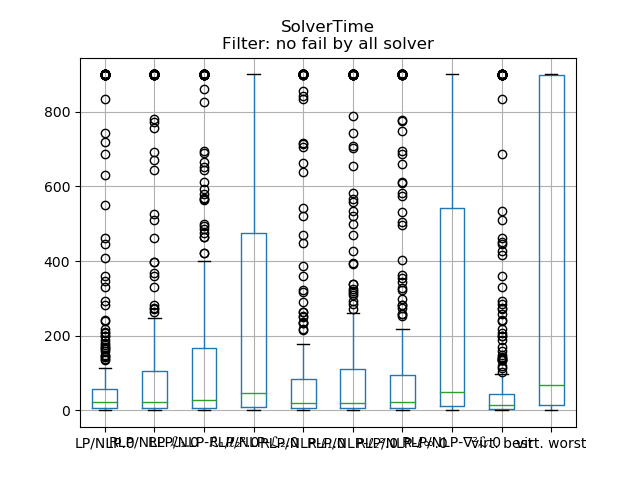
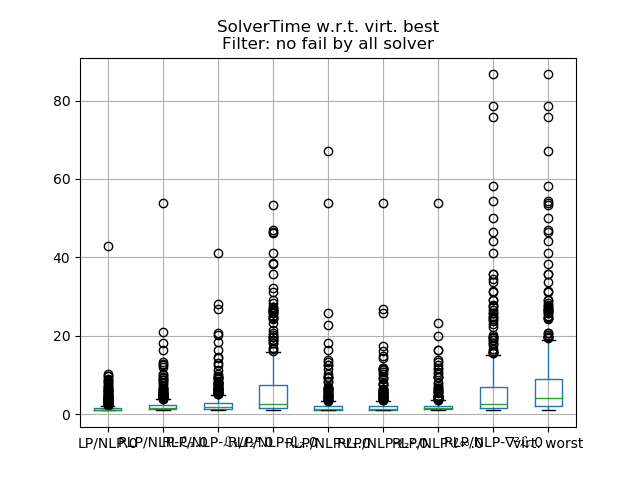
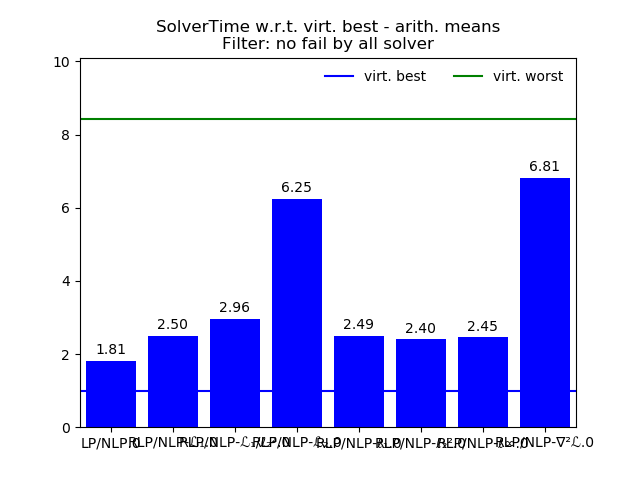
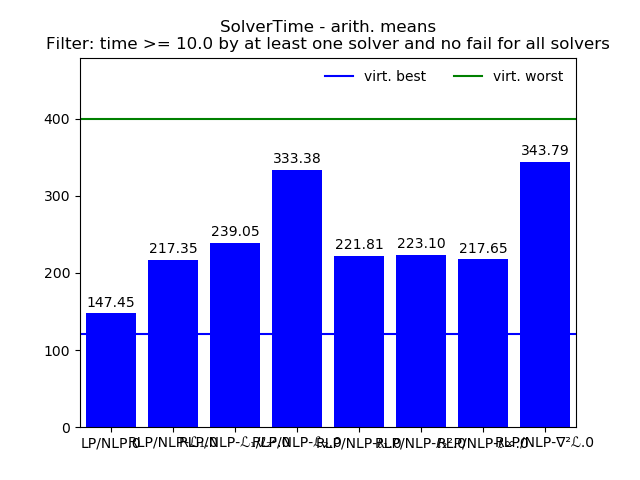
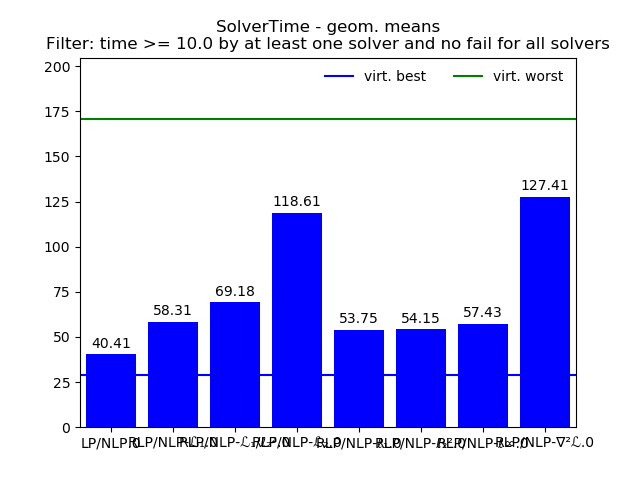
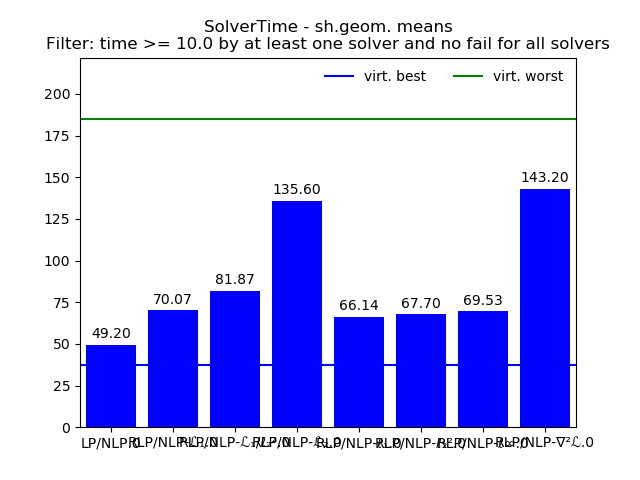
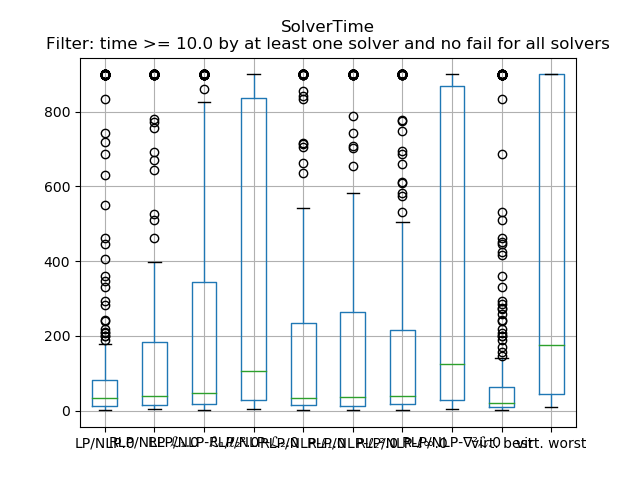
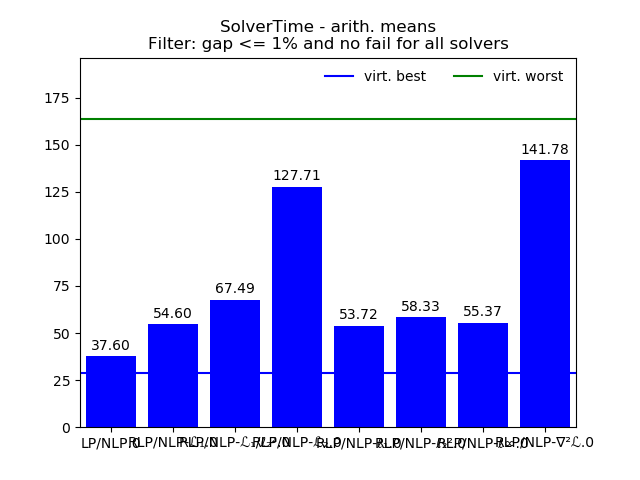
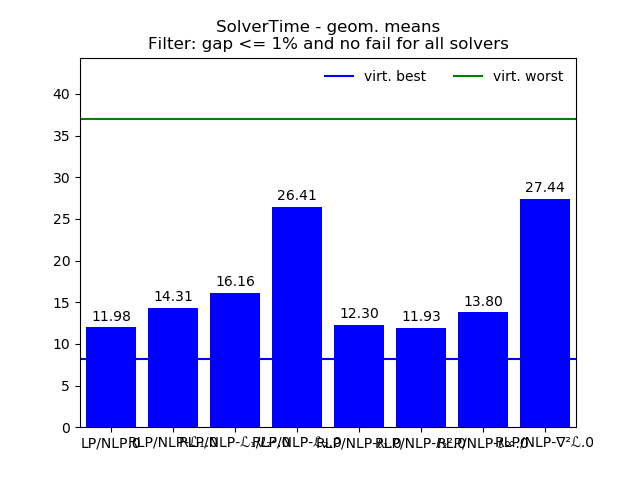
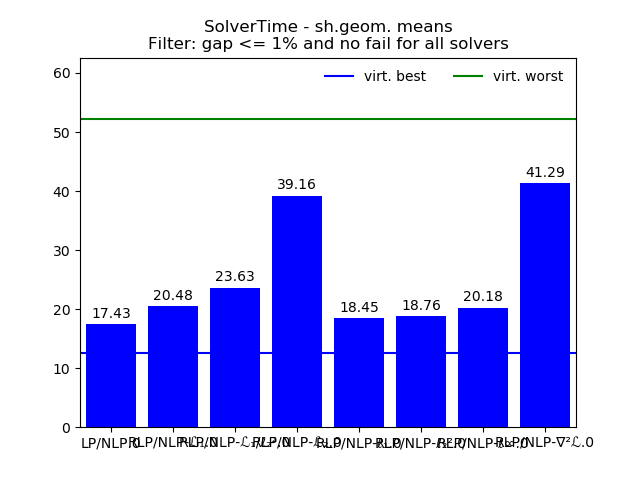
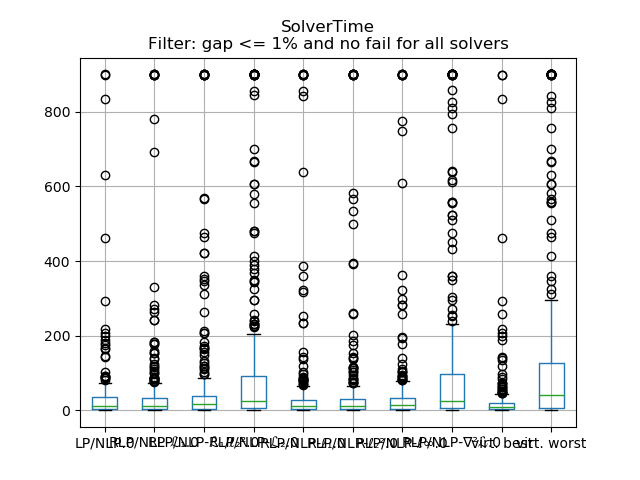
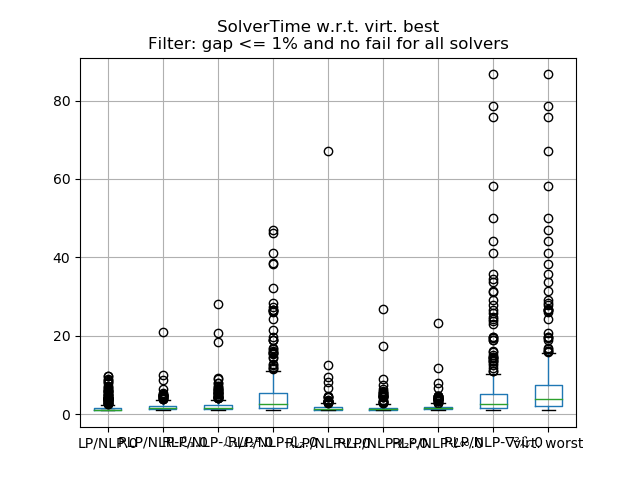
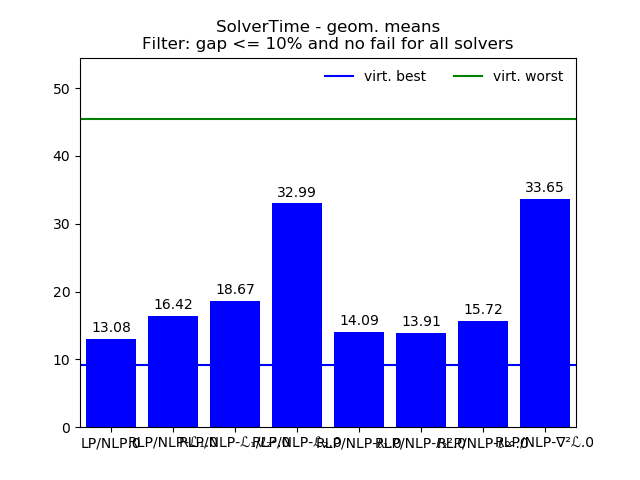
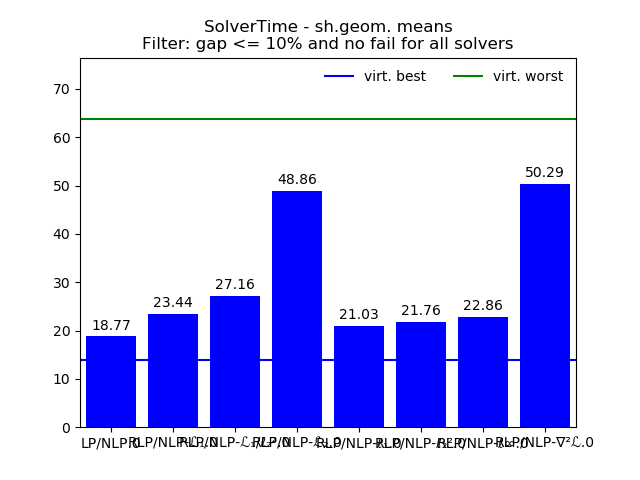
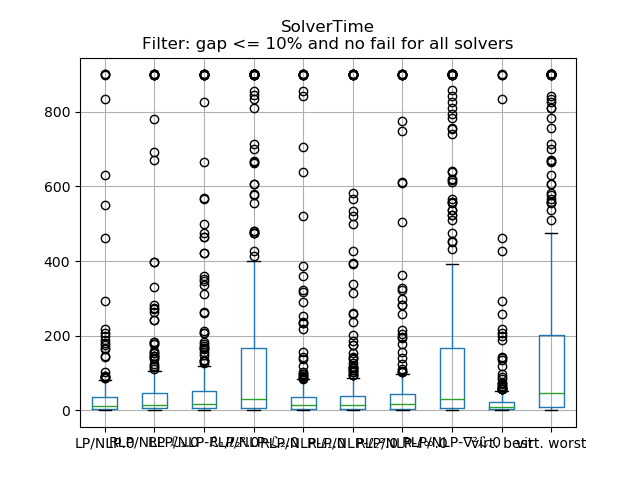
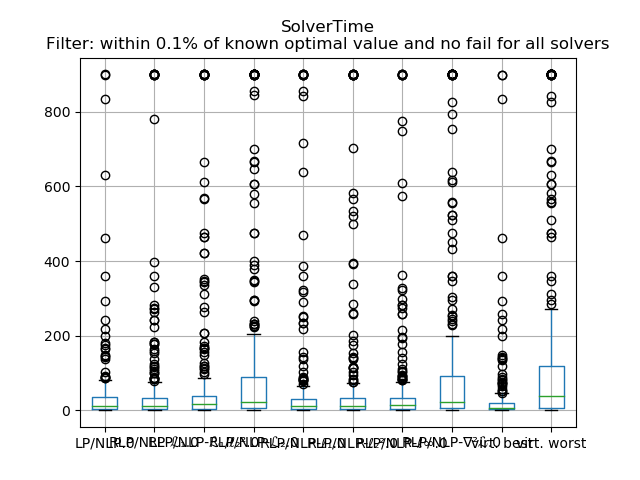
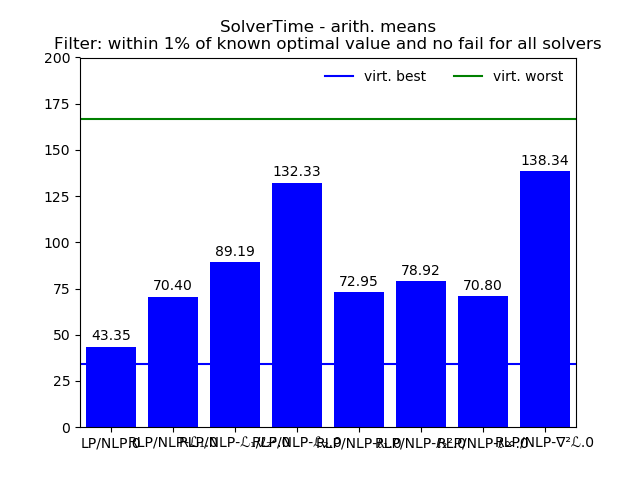
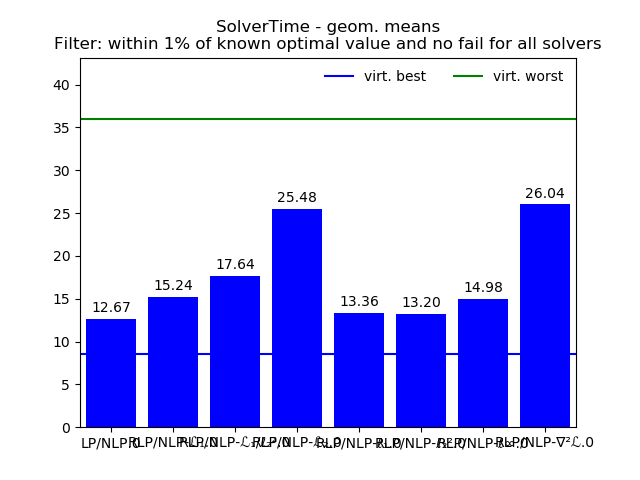
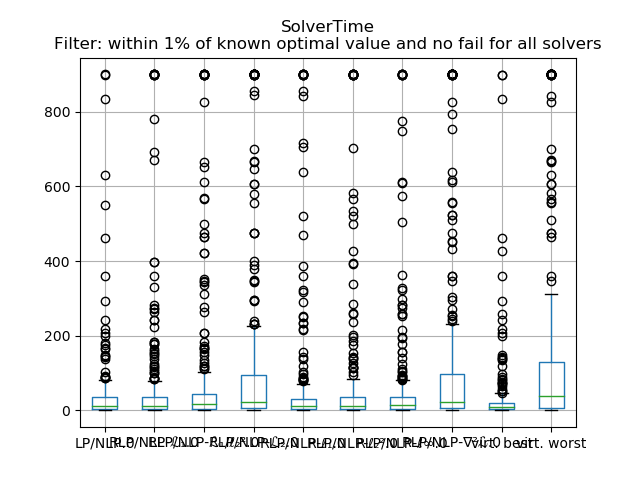
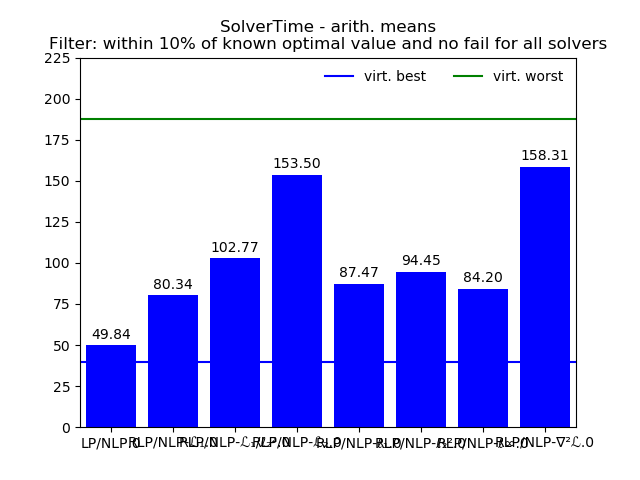
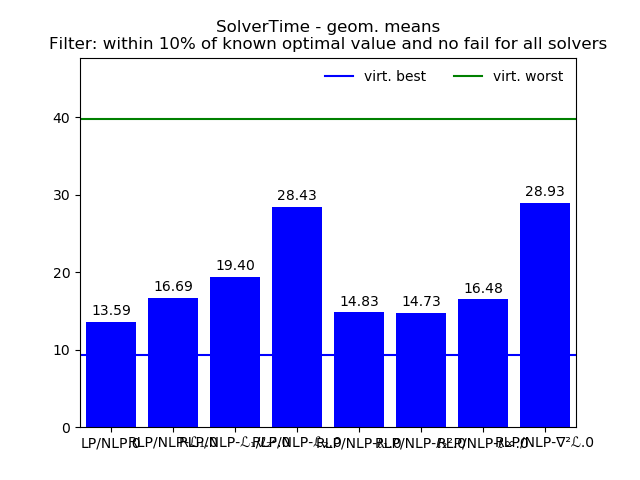
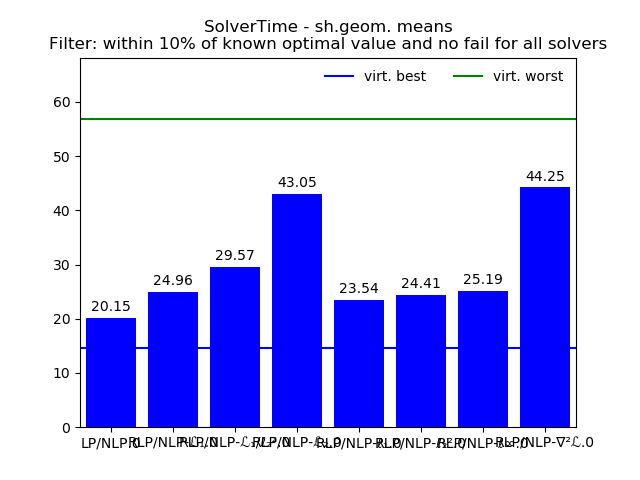
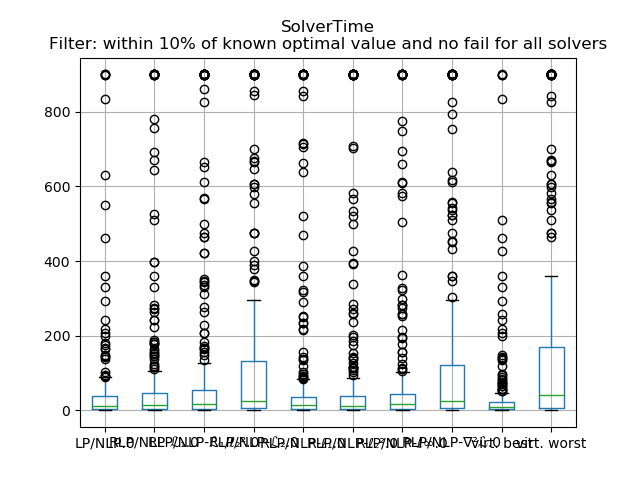
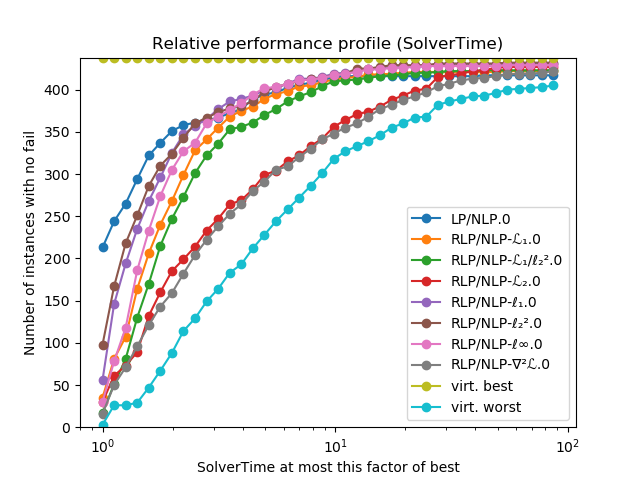
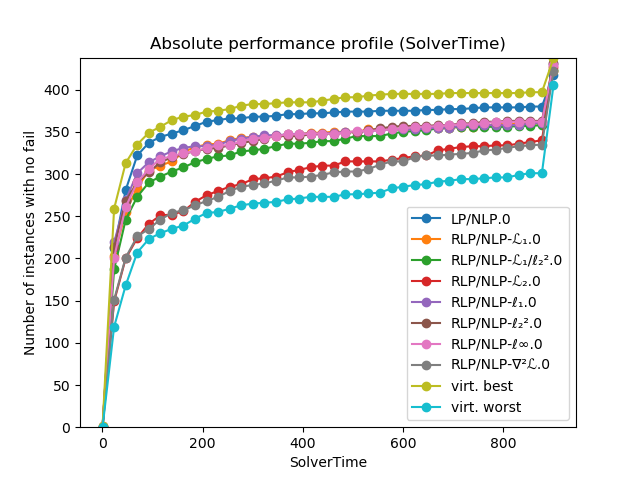
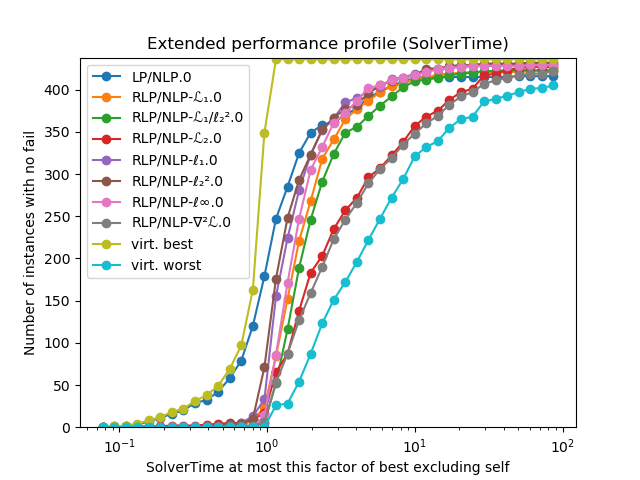
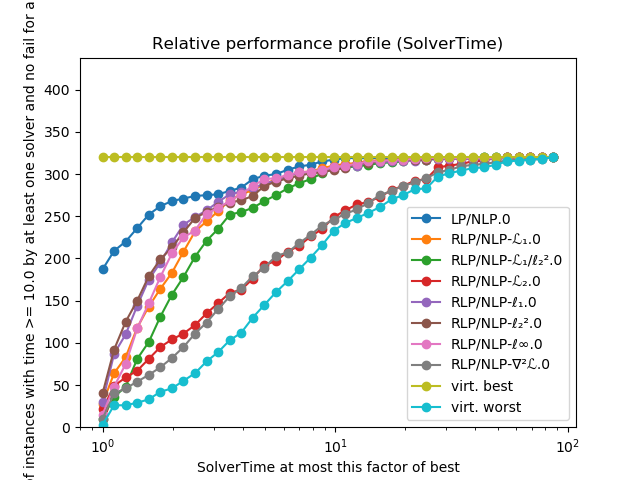
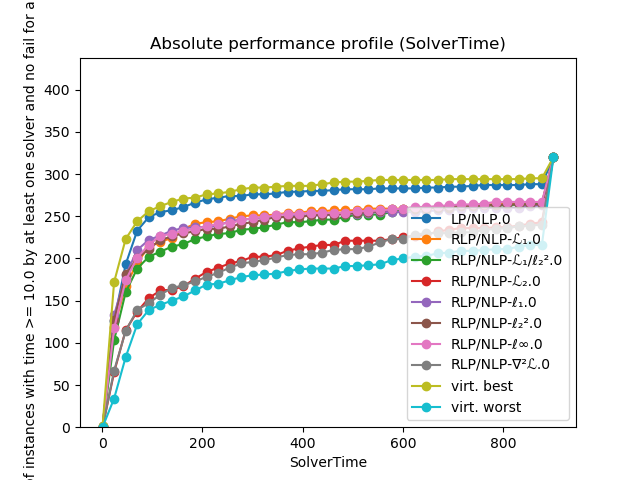
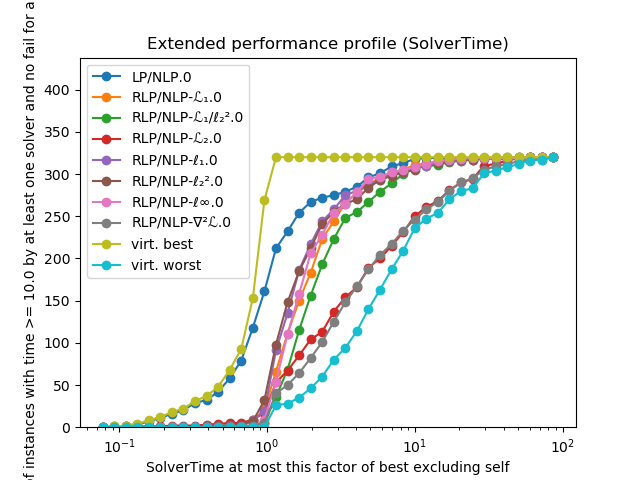
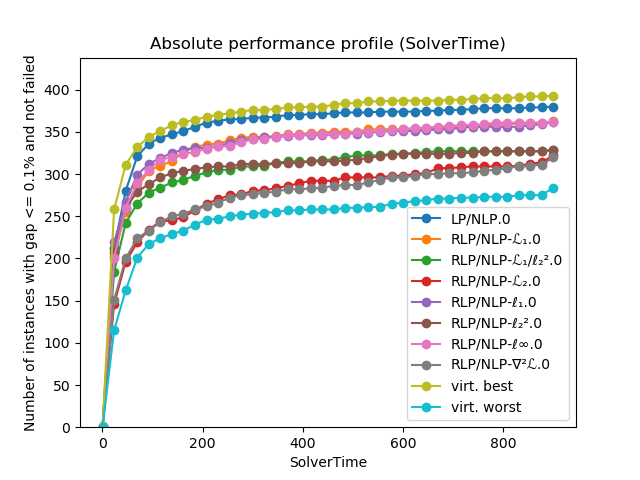
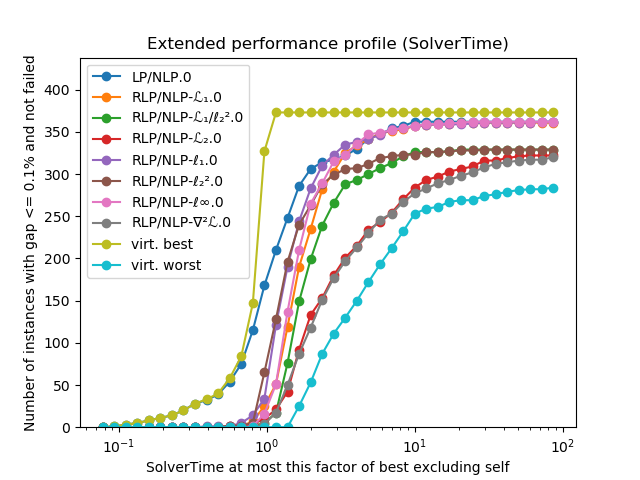
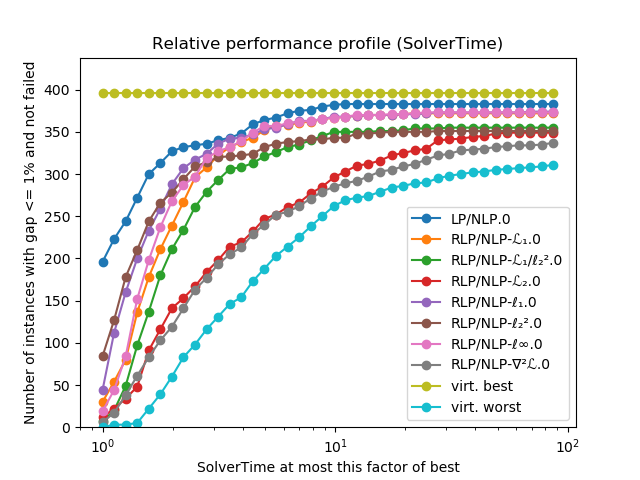
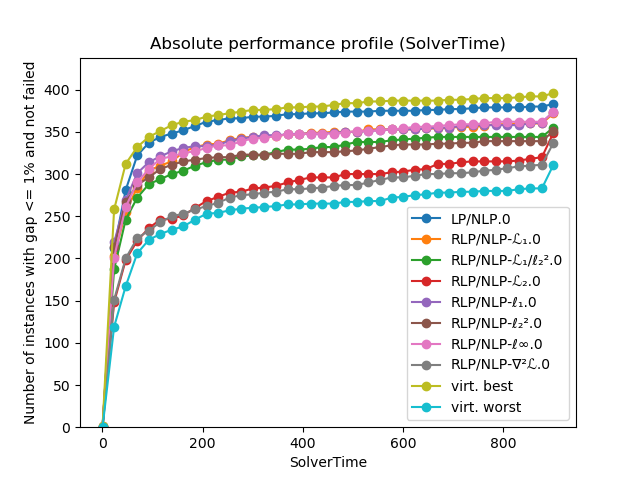
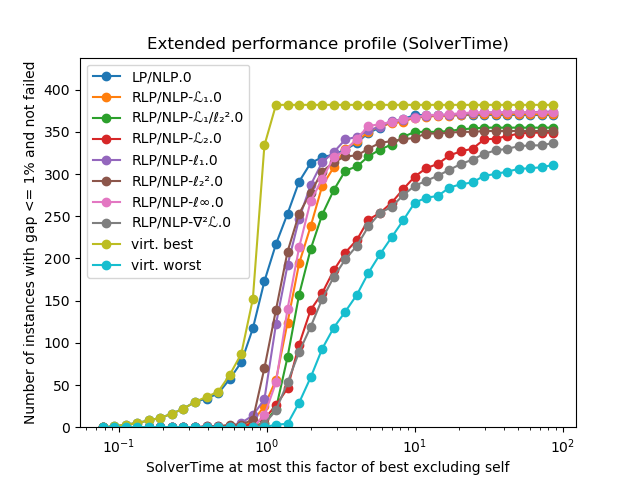
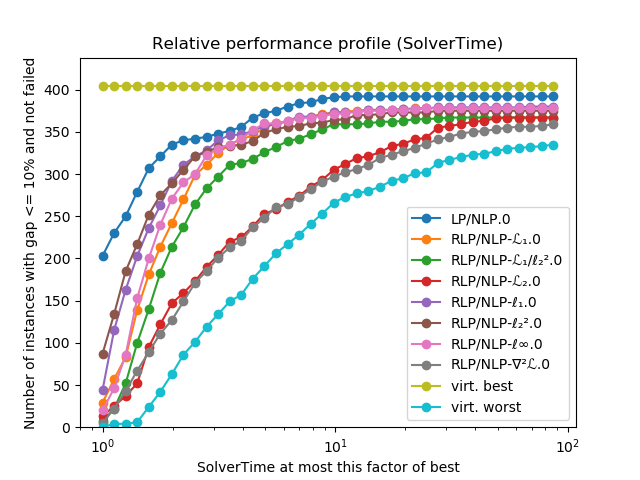
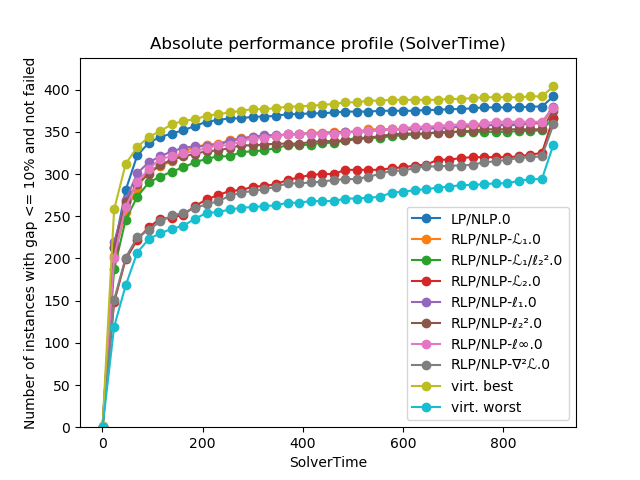
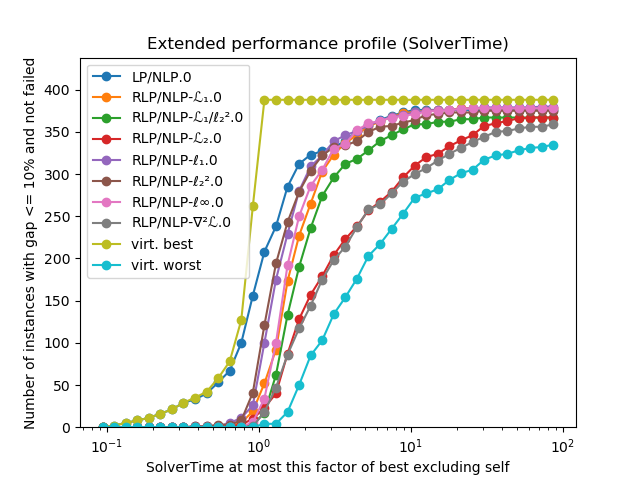
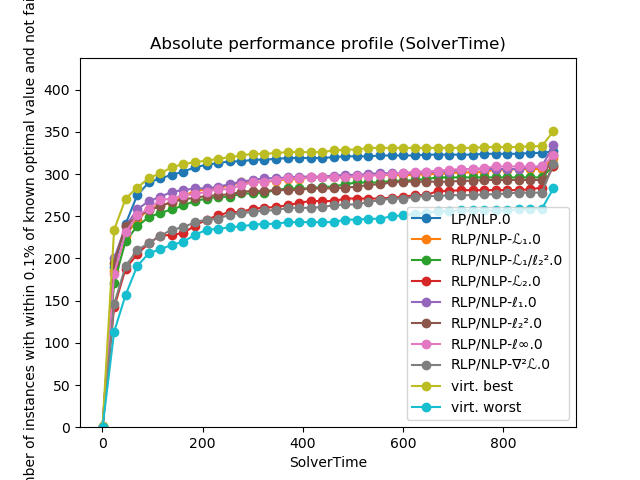
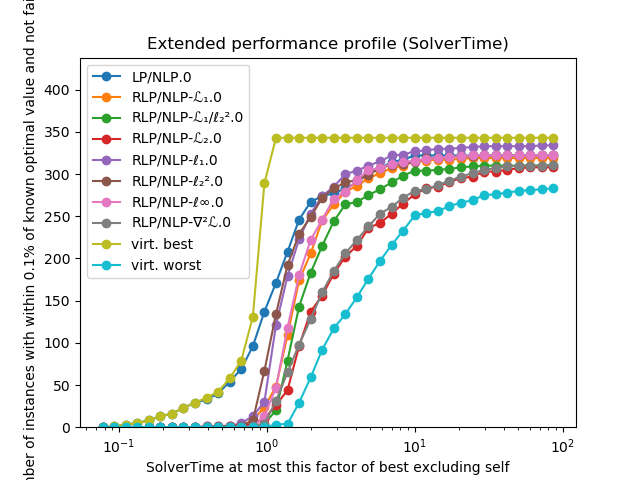
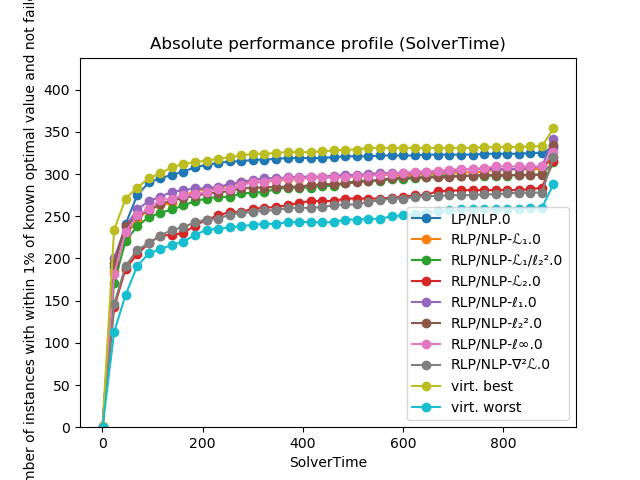
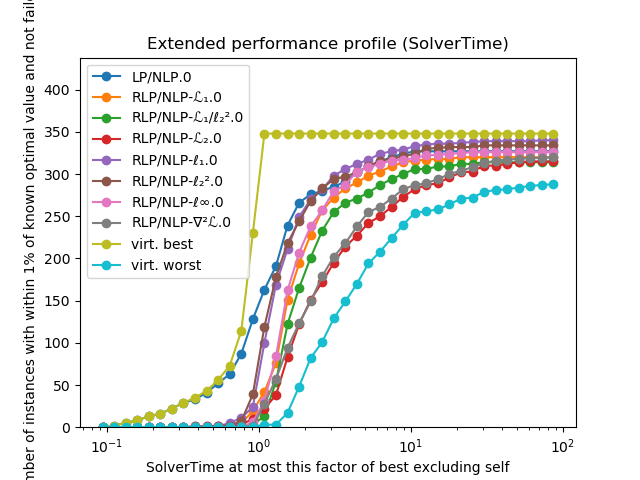
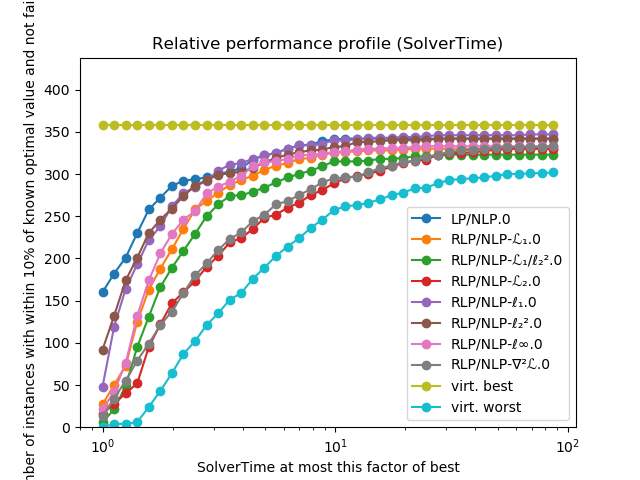
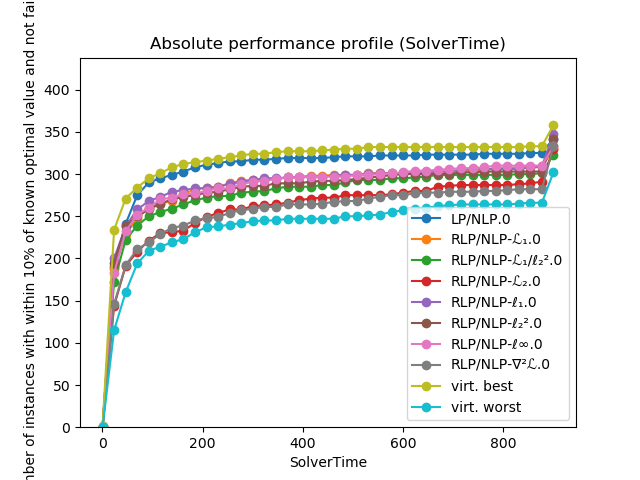
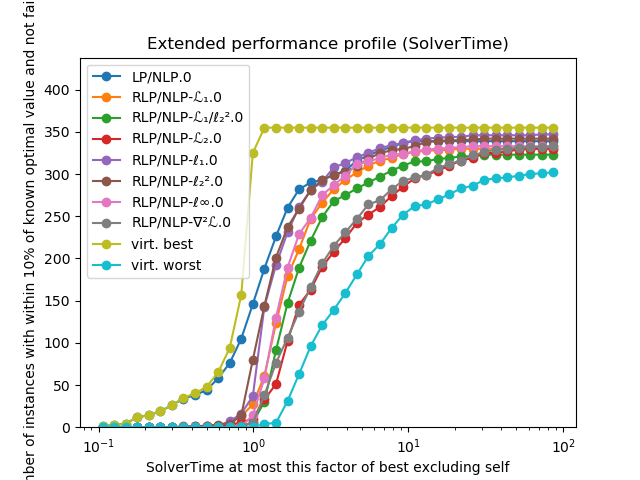
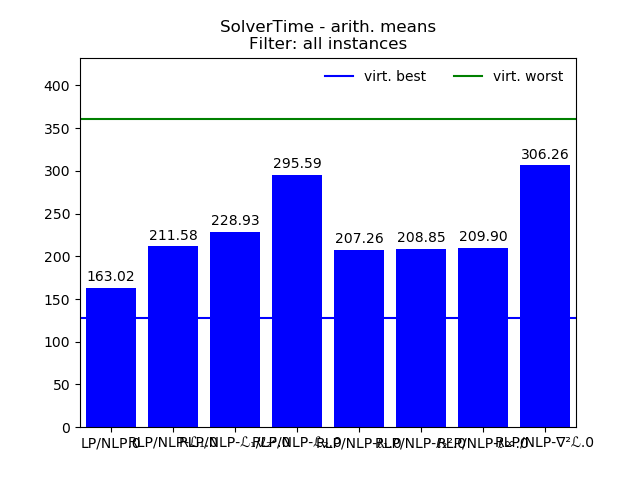
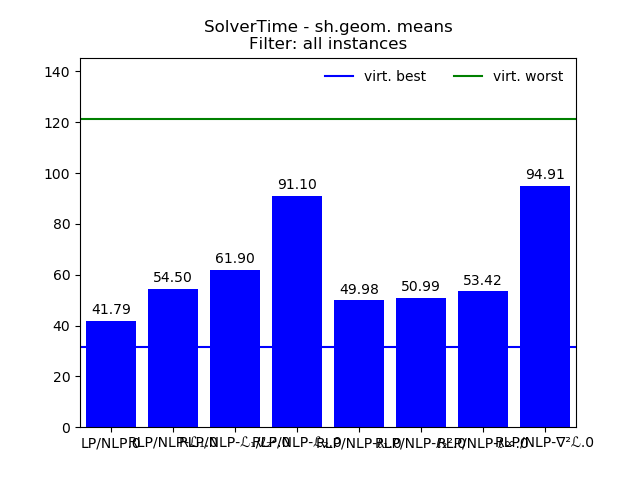
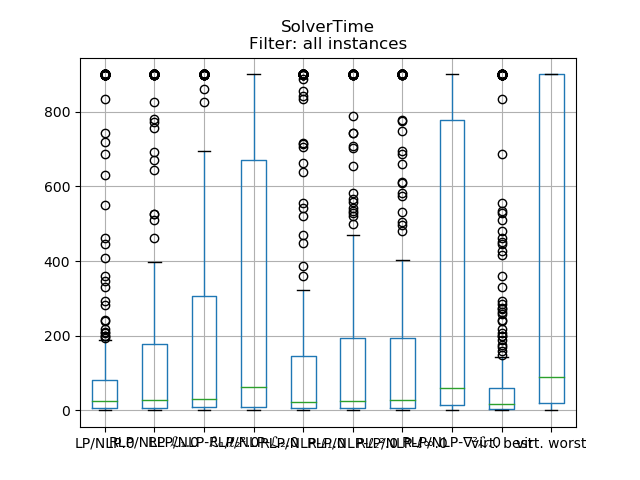
SolverTime
Filter: all instances
Attribute values were projected onto interval [0.1, 900.0].
Missing values and values for failed instances substituted by 900.0 .
| Data | LP/NLP.0 | RLP/NLP-ℒ₁.0 | RLP/NLP-ℒ₁/ℓ₂².0 | RLP/NLP-ℒ₂.0 | RLP/NLP-ℓ₁.0 | RLP/NLP-ℓ₂².0 | RLP/NLP-ℓ∞.0 | RLP/NLP-∇²ℒ.0 | virt. best | virt. worst |
|---|---|---|---|---|---|---|---|---|---|---|
| count | 438.00 | 438.00 | 438.00 | 438.00 | 438.00 | 438.00 | 438.00 | 438.00 | 438.00 | 438.00 |
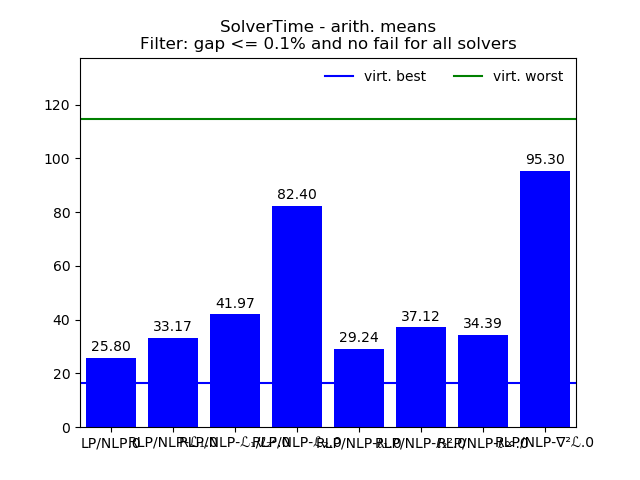
| arith. mean | 163.02 | 211.58 | 228.93 | 295.59 | 207.26 | 208.85 | 209.90 | 306.26 | 127.76 | 360.40 |
| arith. std. | 304.36 | 340.49 | 344.51 | 367.89 | 341.96 | 337.67 | 338.57 | 373.20 | 267.06 | 397.12 |
| geom. mean | 27.80 | 37.08 | 42.21 | 64.42 | 32.31 | 31.96 | 35.61 | 66.72 | 19.49 | 90.33 |
| geom. std. | 7.23 | 7.87 | 8.21 | 8.70 | 8.44 | 8.97 | 8.12 | 8.94 | 7.22 | 8.44 |
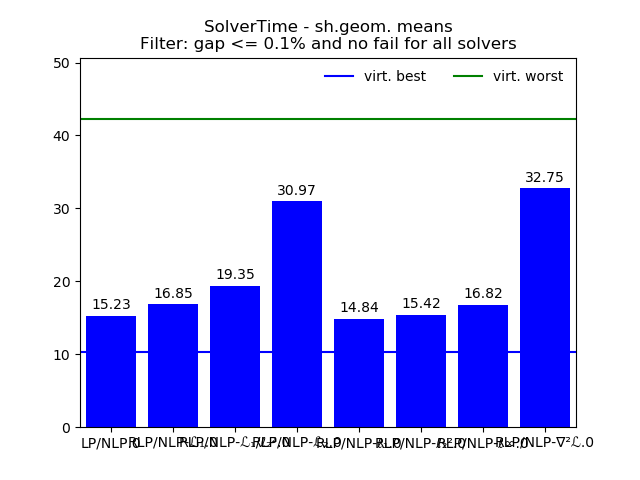
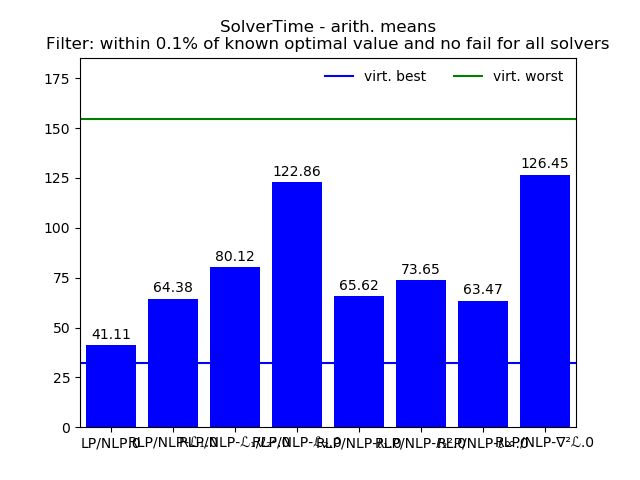
| sh.geom. mean | 41.79 | 54.50 | 61.90 | 91.10 | 49.98 | 50.99 | 53.42 | 94.91 | 31.45 | 121.22 |
| sh.geom. std. | 4.15 | 4.68 | 4.81 | 5.16 | 4.76 | 4.84 | 4.70 | 5.22 | 3.88 | 5.24 |
| min | 0.34 | 0.28 | 0.26 | 0.28 | 0.41 | 0.33 | 0.23 | 0.26 | 0.23 | 0.41 |
| 10.0% | 2.35 | 2.65 | 2.61 | 3.13 | 2.09 | 1.84 | 2.63 | 2.87 | 1.67 | 3.99 |
| 25.0% | 6.56 | 7.95 | 8.99 | 10.16 | 6.70 | 6.13 | 6.79 | 14.42 | 4.77 | 20.56 |
| 50.0% | 25.16 | 27.62 | 31.66 | 62.18 | 23.26 | 24.65 | 27.39 | 61.00 | 16.88 | 89.93 |
| 75.0% | 81.51 | 178.35 | 305.79 | 671.46 | 145.06 | 193.56 | 192.88 | 776.67 | 61.08 | 900.00 |
| 90.0% | 899.69 | 900.00 | 900.00 | 900.00 | 900.00 | 900.00 | 900.00 | 900.00 | 539.75 | 900.00 |
| max | 900.00 | 900.00 | 900.00 | 900.00 | 900.00 | 900.00 | 900.00 | 900.00 | 900.00 | 900.00 |

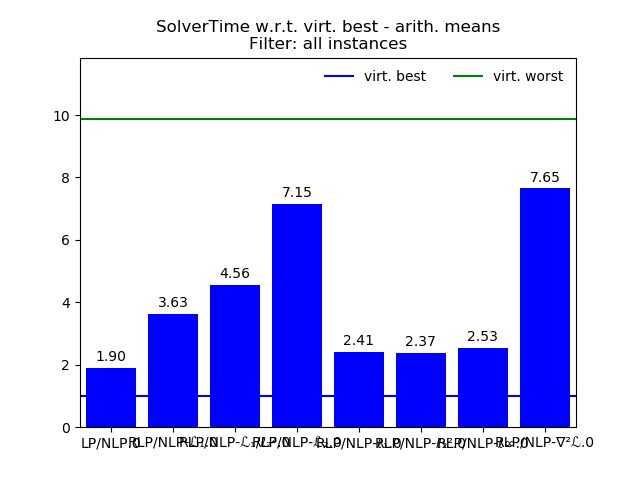
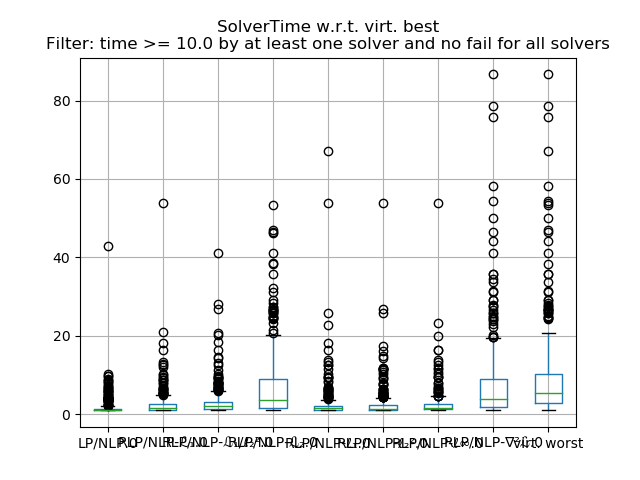
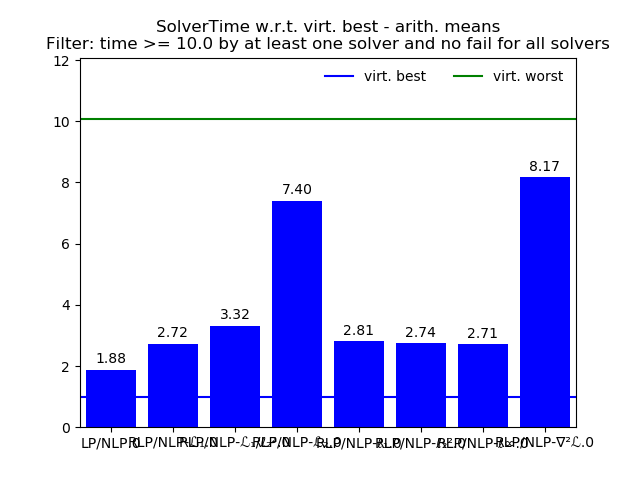
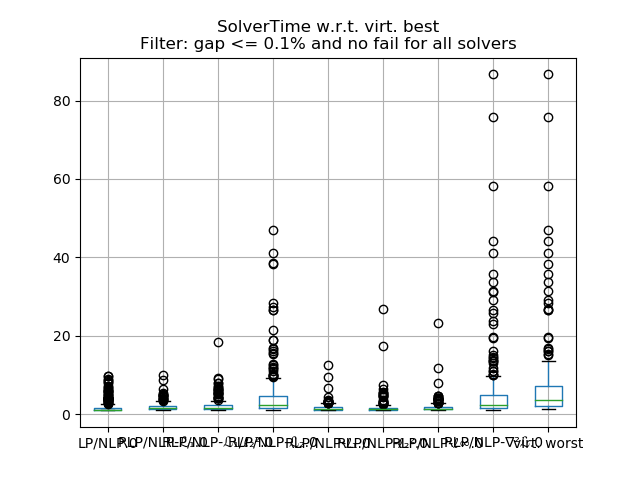
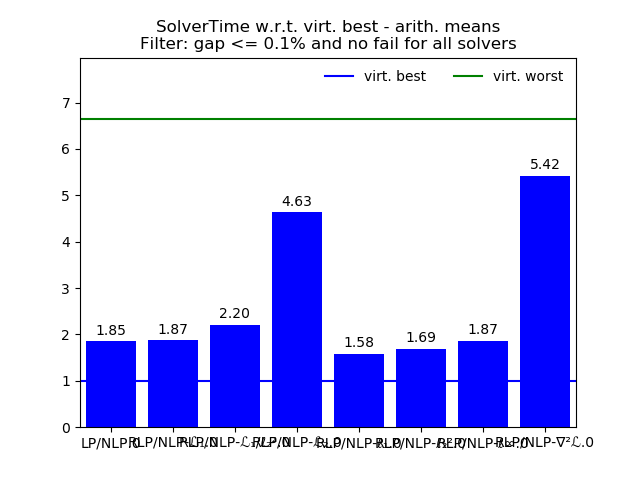
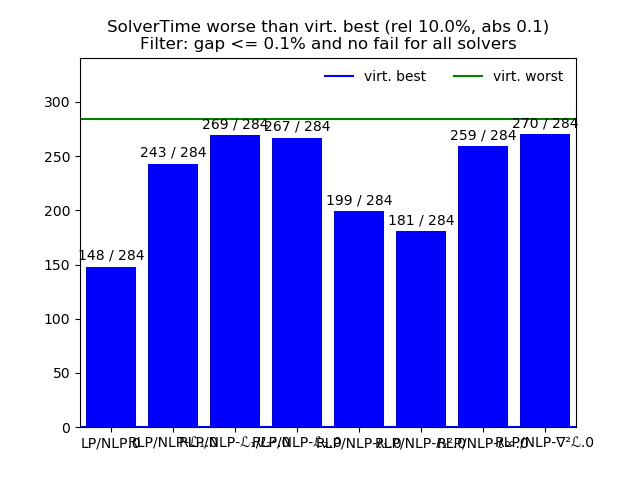
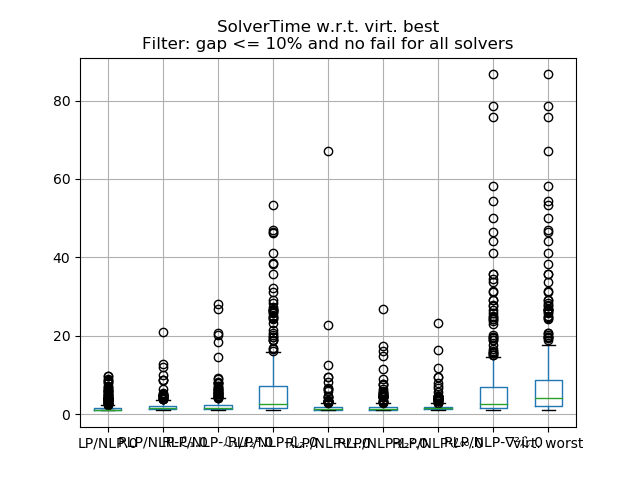
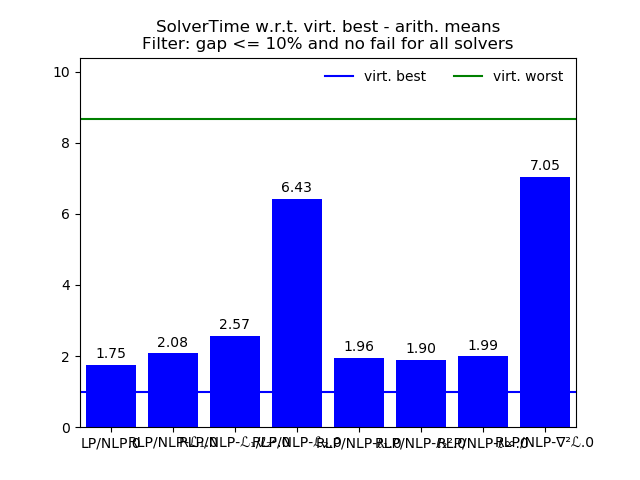
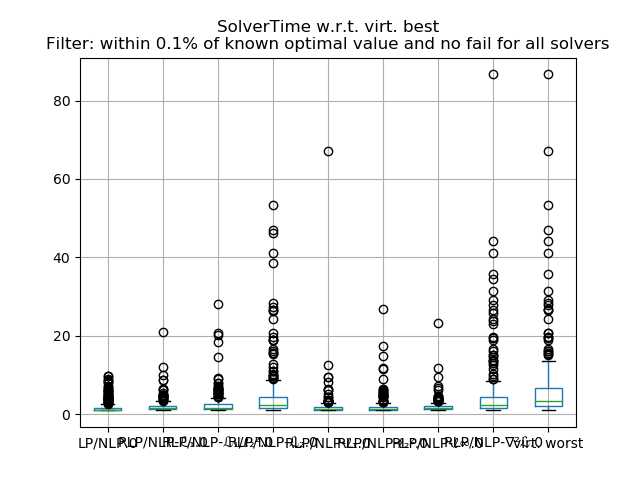
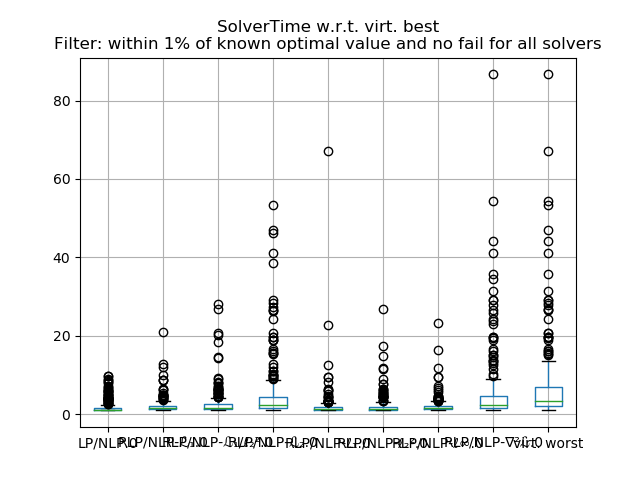
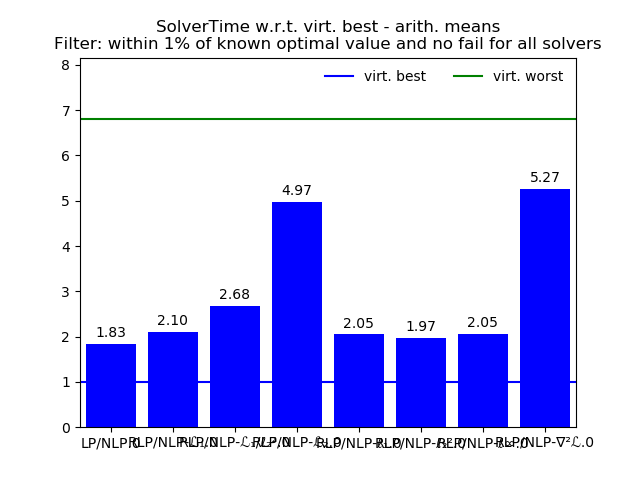
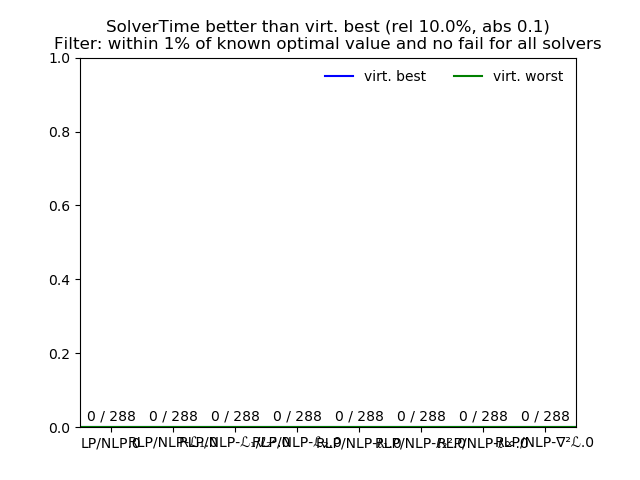
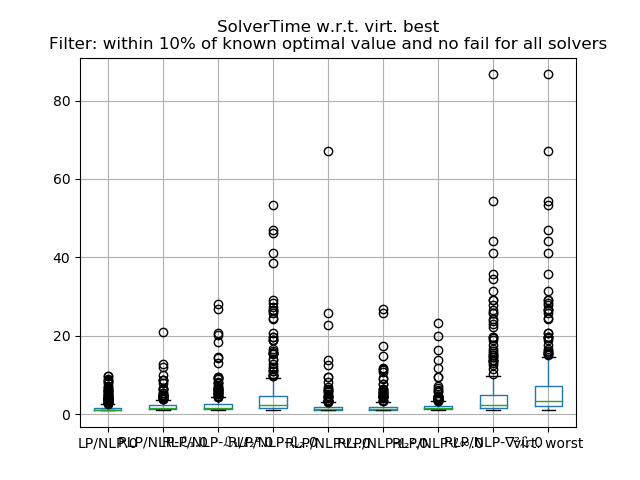
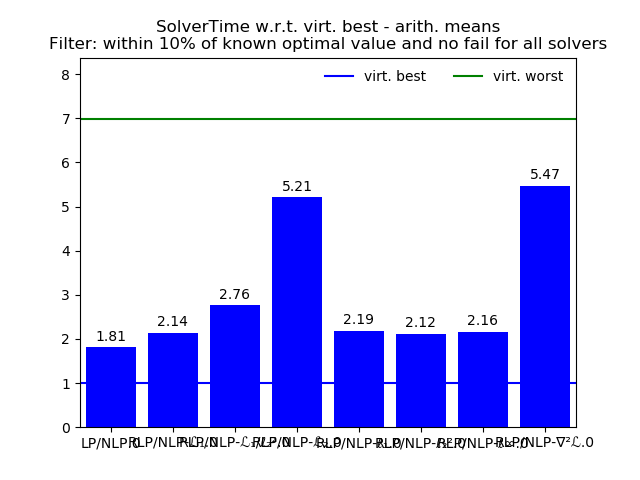
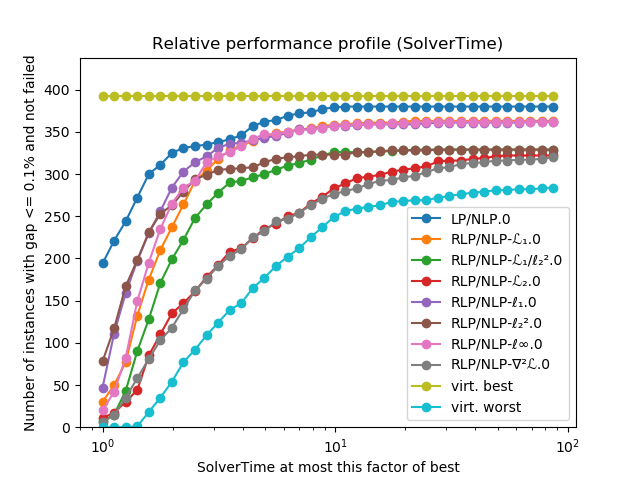
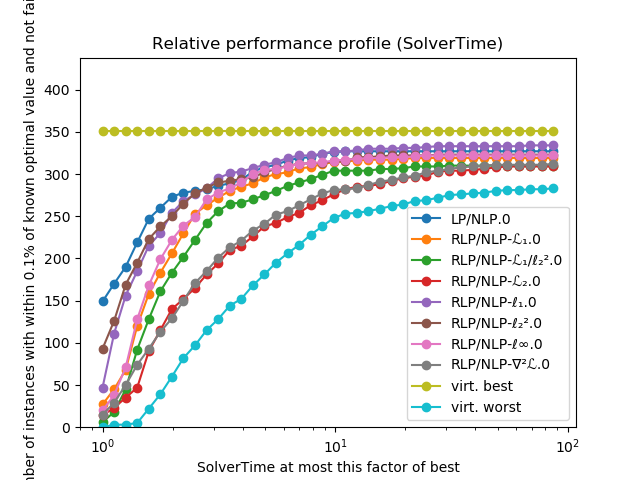
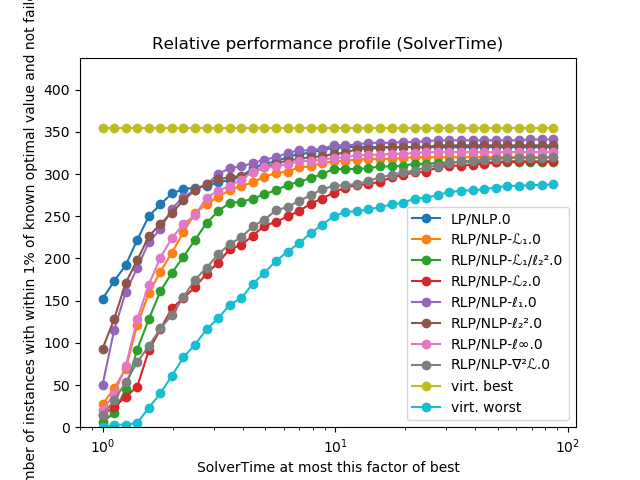
Performance with respect to virt. best:
Tolerance:
relative 0.1
absolute 0.1
| Data | LP/NLP.0 | RLP/NLP-ℒ₁.0 | RLP/NLP-ℒ₁/ℓ₂².0 | RLP/NLP-ℒ₂.0 | RLP/NLP-ℓ₁.0 | RLP/NLP-ℓ₂².0 | RLP/NLP-ℓ∞.0 | RLP/NLP-∇²ℒ.0 | virt. worst |
|---|---|---|---|---|---|---|---|---|---|
| count | 438.00 | 438.00 | 438.00 | 438.00 | 438.00 | 438.00 | 438.00 | 438.00 | 438.00 |
| arith. mean | 1.90 | 3.63 | 4.56 | 7.15 | 2.41 | 2.37 | 2.53 | 7.65 | 9.87 |
| arith. std. | 2.78 | 23.91 | 26.19 | 24.92 | 4.75 | 3.88 | 4.04 | 25.67 | 28.10 |
| min | 1.00 | 1.00 | 1.00 | 1.00 | 1.00 | 1.00 | 1.00 | 1.00 | 1.00 |
| 10.0% | 1.00 | 1.00 | 1.00 | 1.00 | 1.00 | 1.00 | 1.00 | 1.00 | 1.39 |
| 25.0% | 1.00 | 1.23 | 1.33 | 1.46 | 1.06 | 1.00 | 1.22 | 1.44 | 2.00 |
| 50.0% | 1.00 | 1.60 | 1.74 | 2.47 | 1.34 | 1.26 | 1.51 | 2.61 | 4.20 |
| 75.0% | 1.55 | 2.36 | 2.77 | 7.07 | 1.97 | 2.00 | 2.18 | 6.90 | 8.98 |
| 90.0% | 4.05 | 4.50 | 6.08 | 16.05 | 3.74 | 4.58 | 4.16 | 16.06 | 20.73 |
| max | 42.89 | 497.55 | 497.55 | 497.55 | 67.11 | 53.76 | 53.76 | 497.55 | 497.55 |
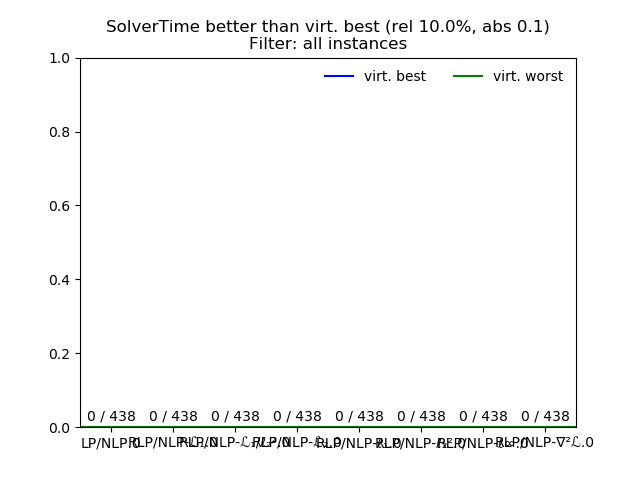
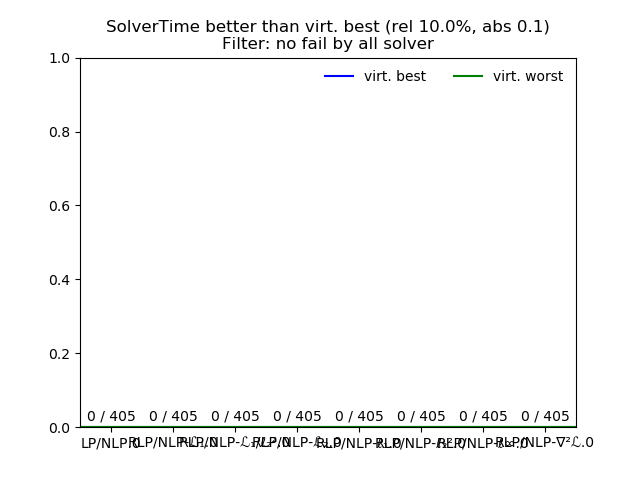
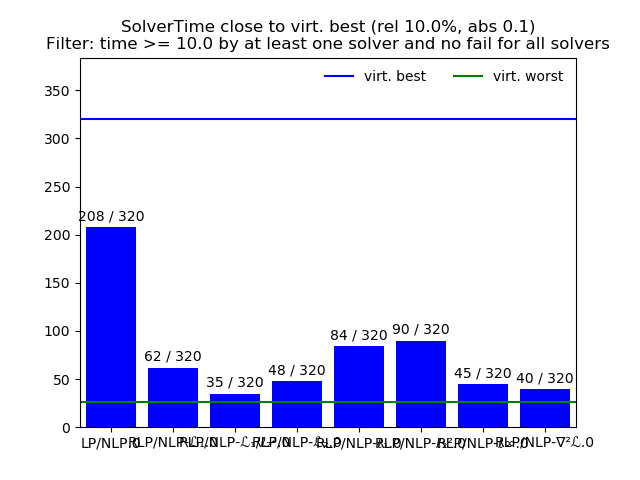
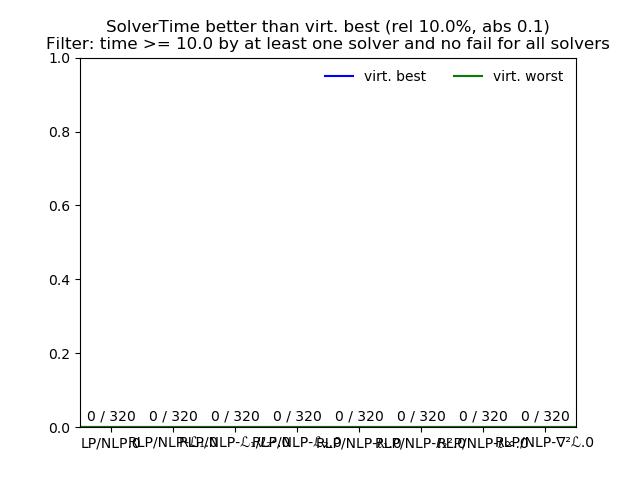
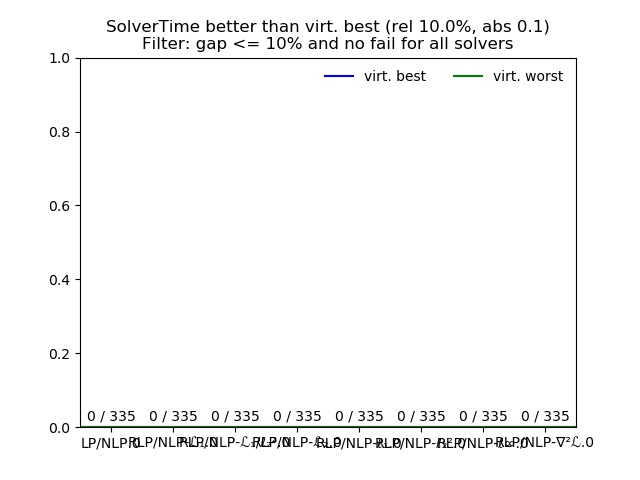
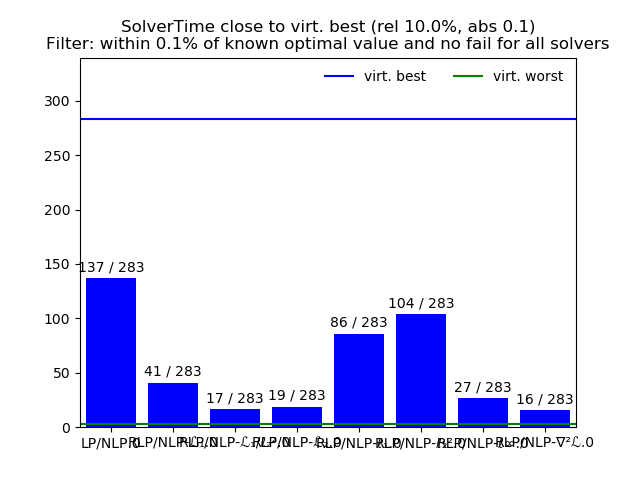
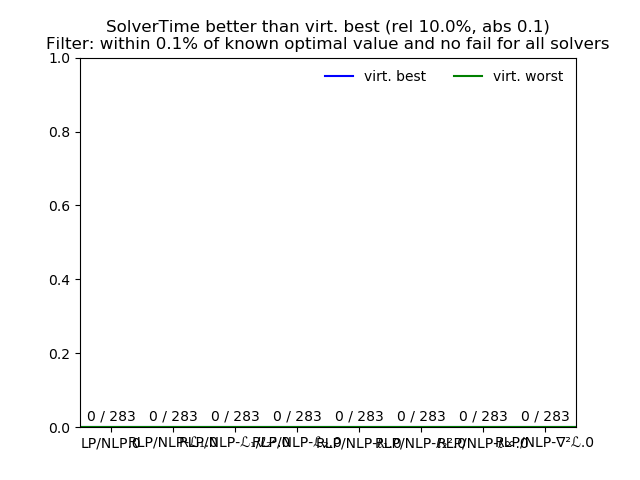
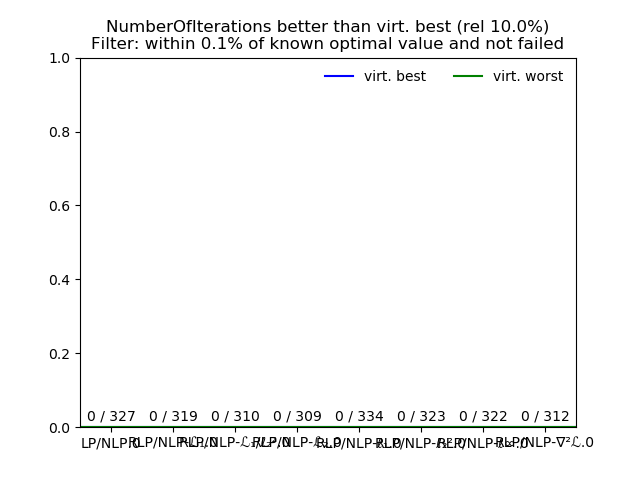
| better | 0.00 | 0.00 | 0.00 | 0.00 | 0.00 | 0.00 | 0.00 | 0.00 | 0.00 |
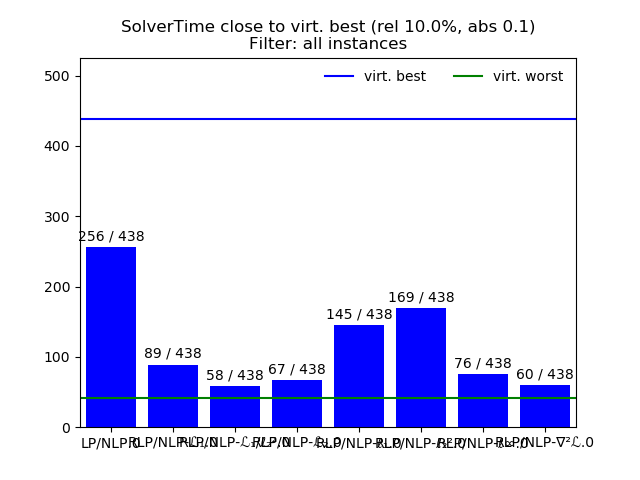
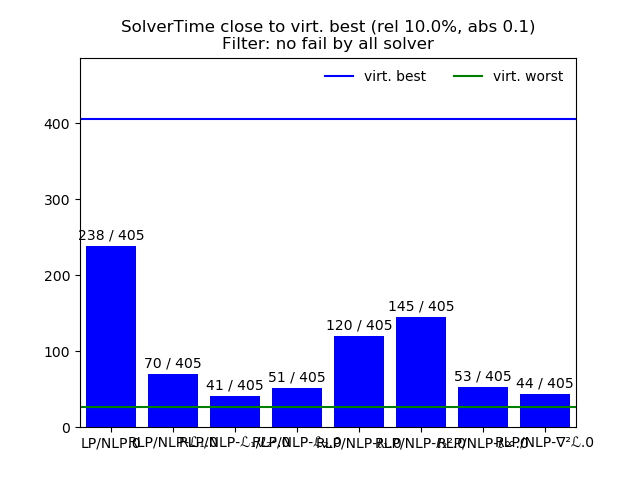
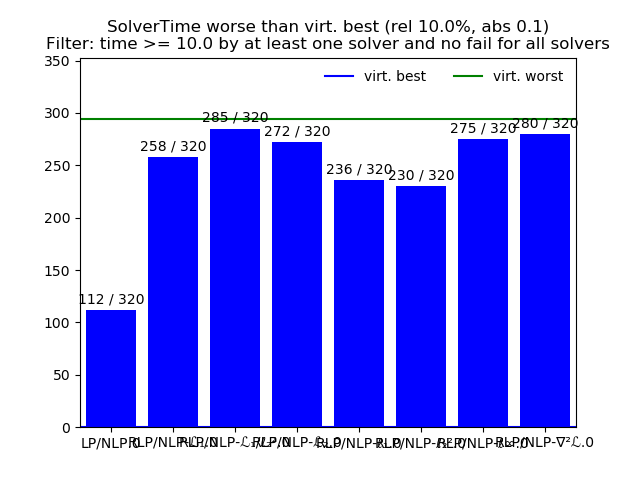
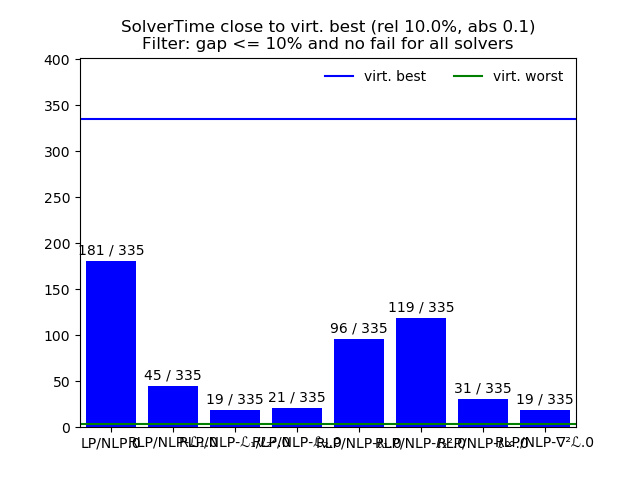
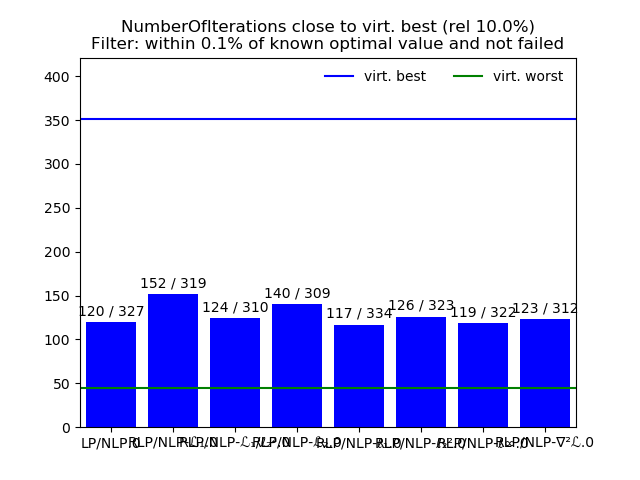
| close | 256.00 | 89.00 | 58.00 | 67.00 | 145.00 | 169.00 | 76.00 | 60.00 | 42.00 |
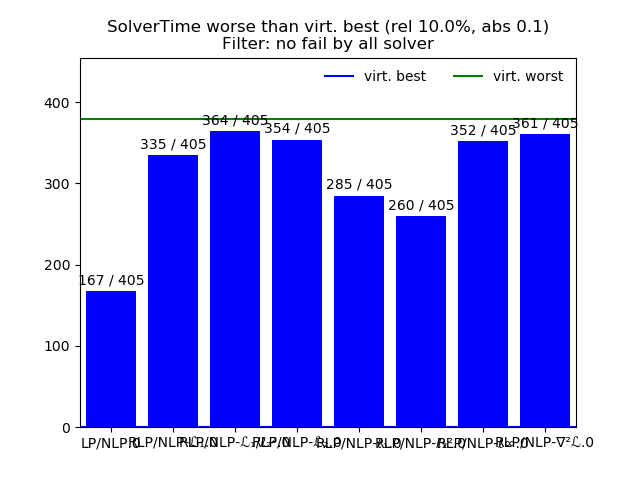
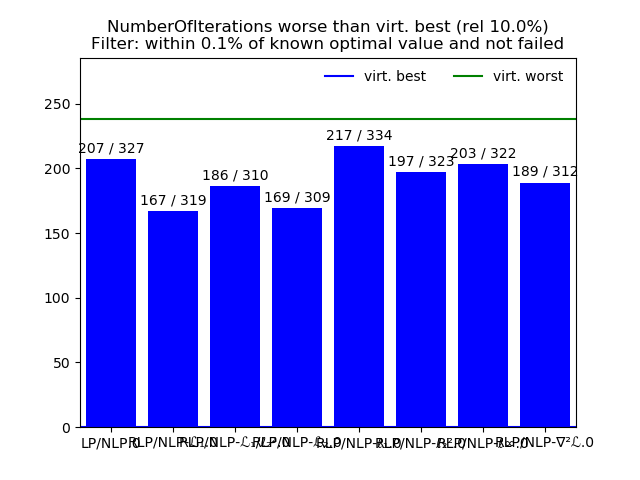
| worse | 182.00 | 349.00 | 380.00 | 371.00 | 293.00 | 269.00 | 362.00 | 378.00 | 396.00 |