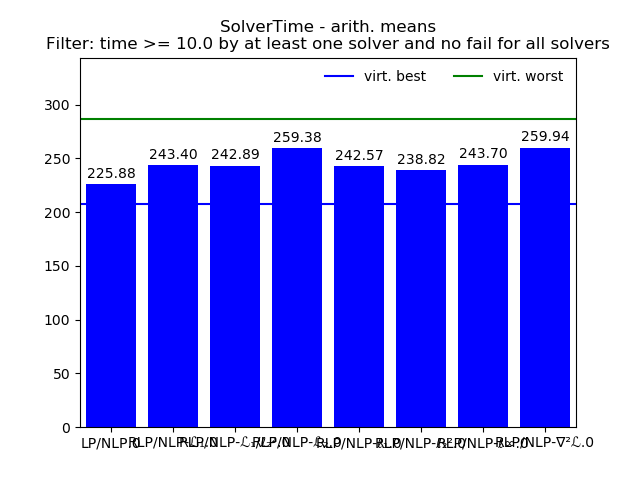
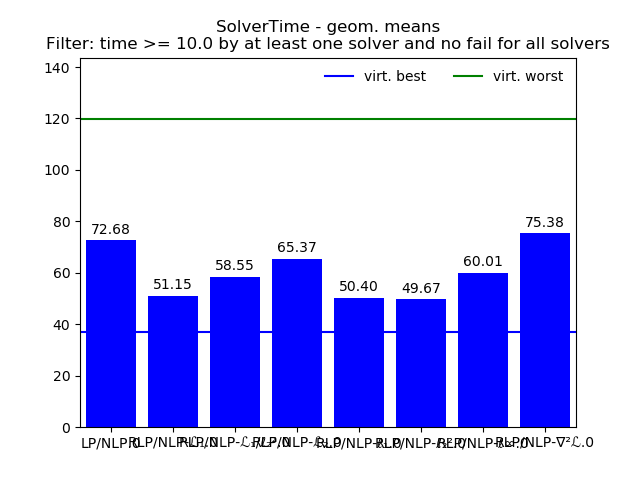
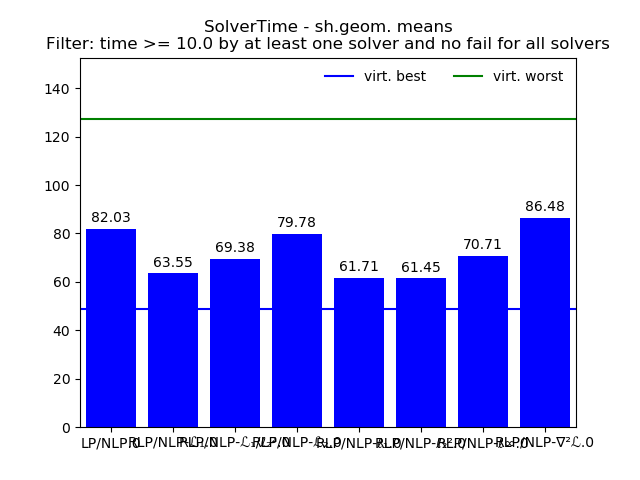
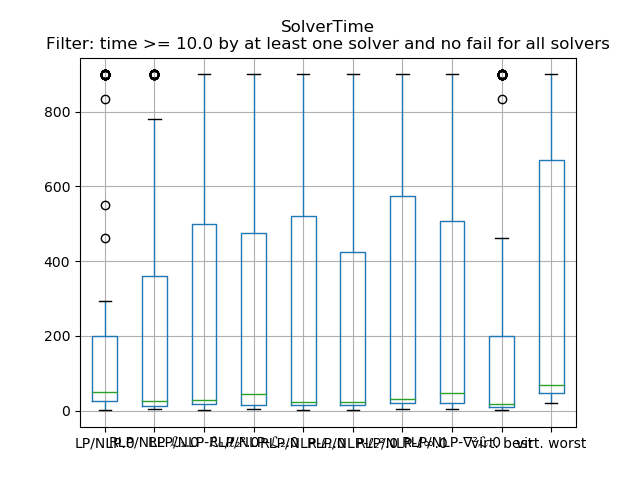
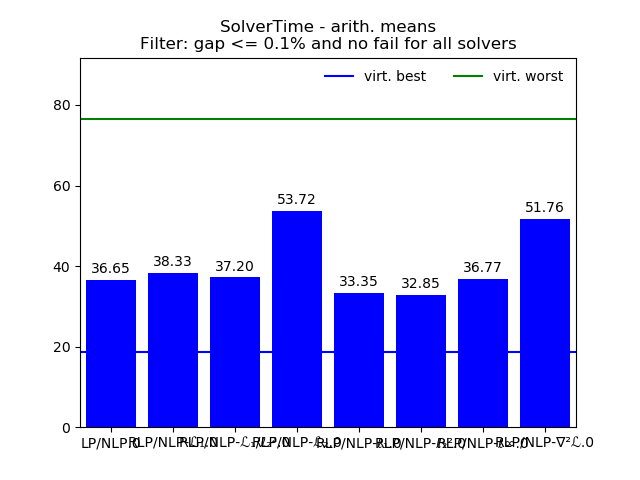
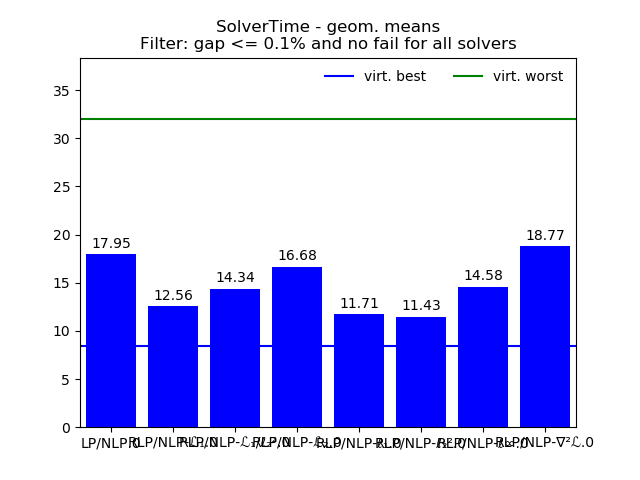
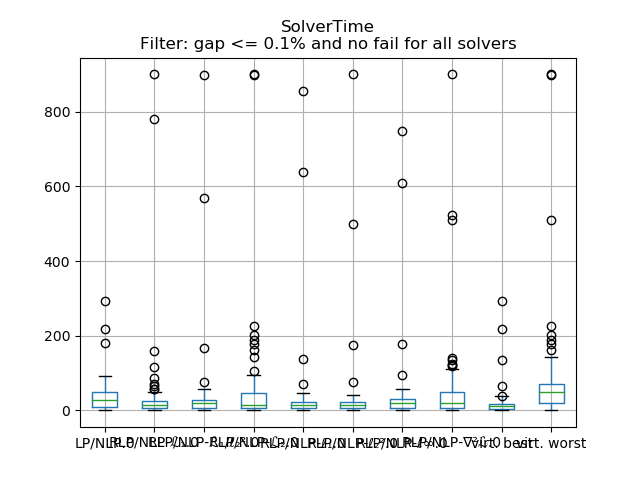
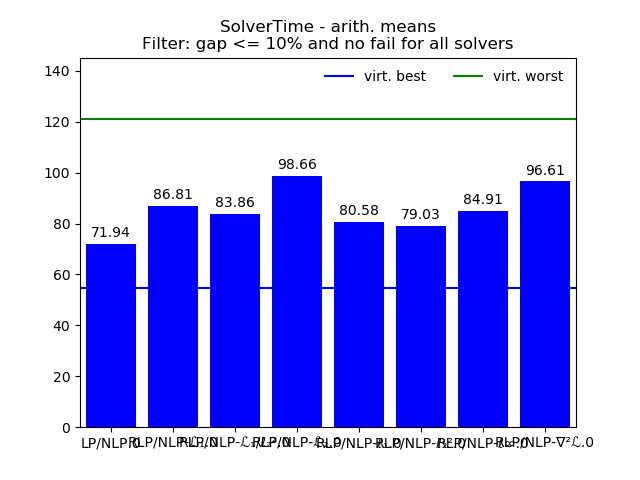
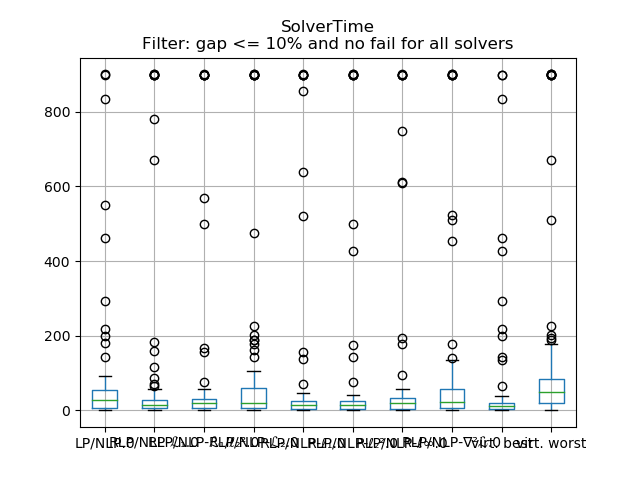
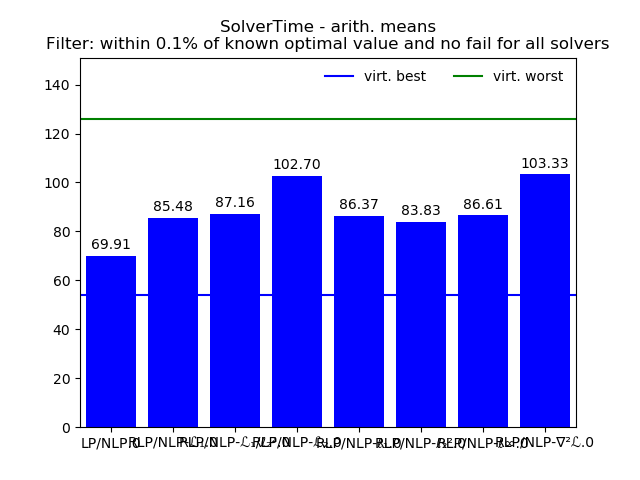
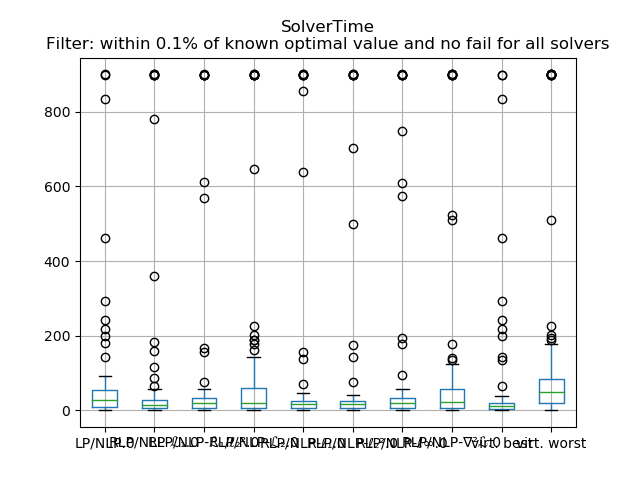
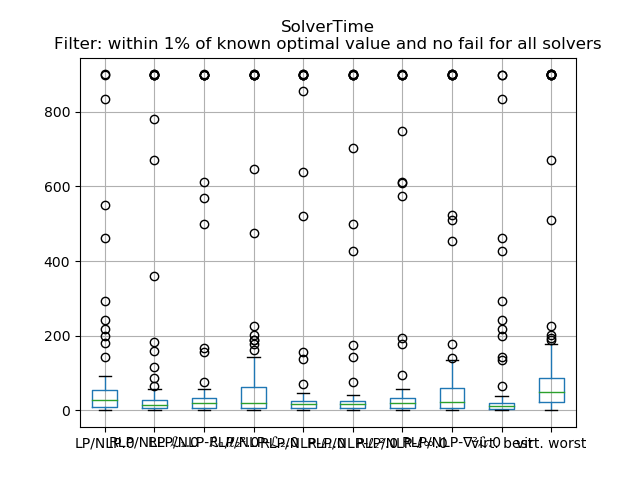
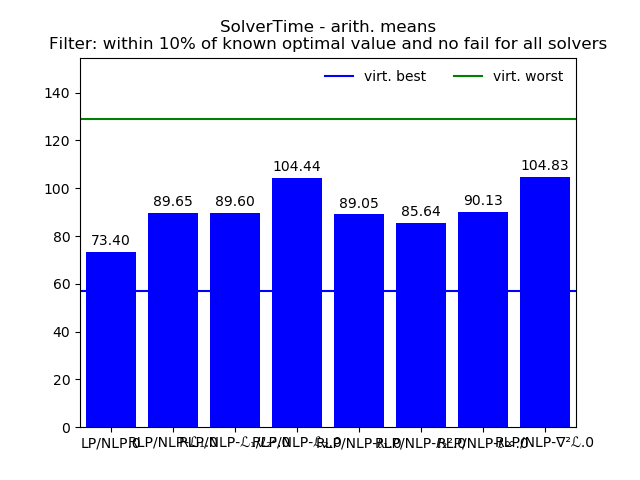
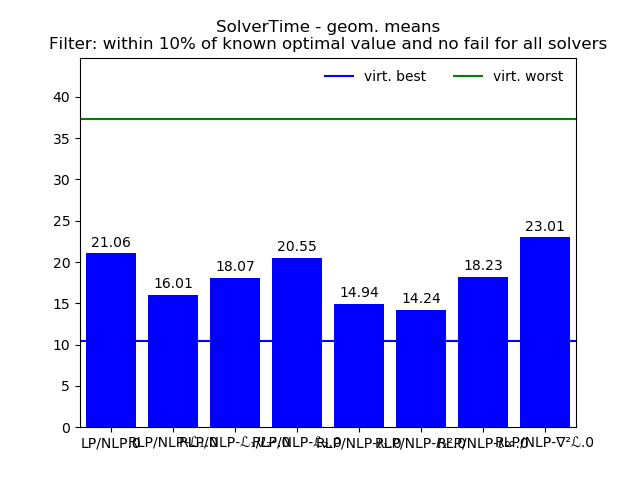
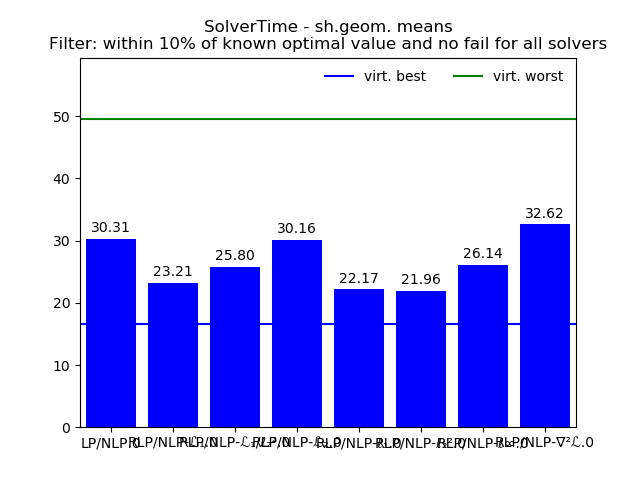
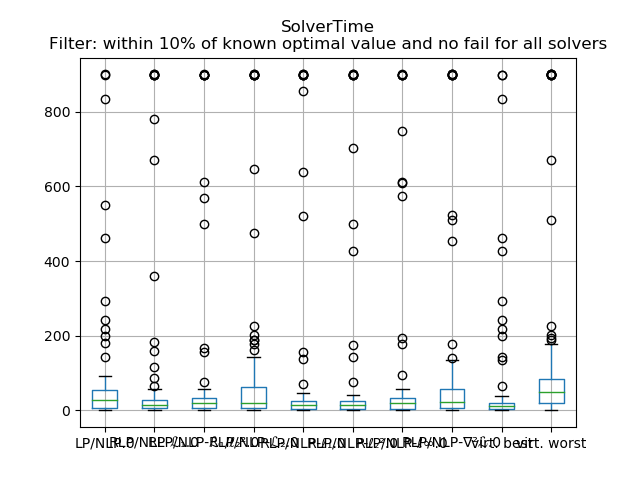
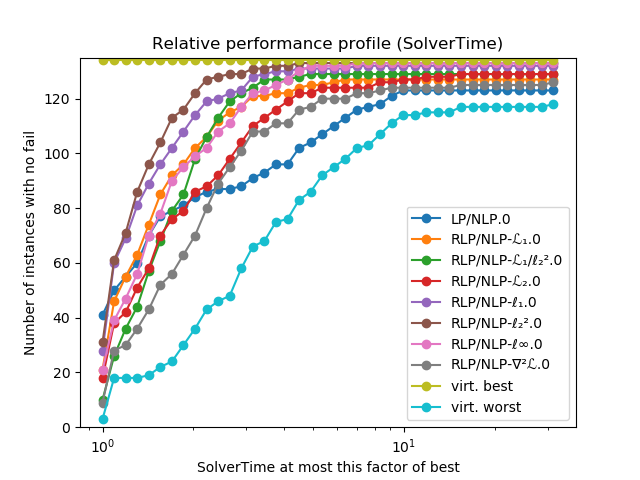
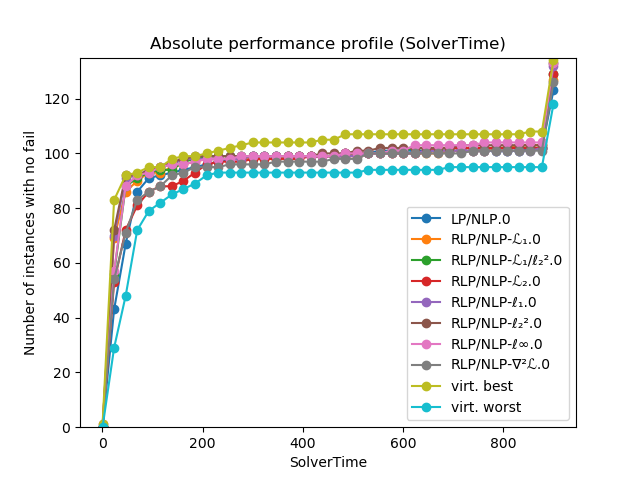
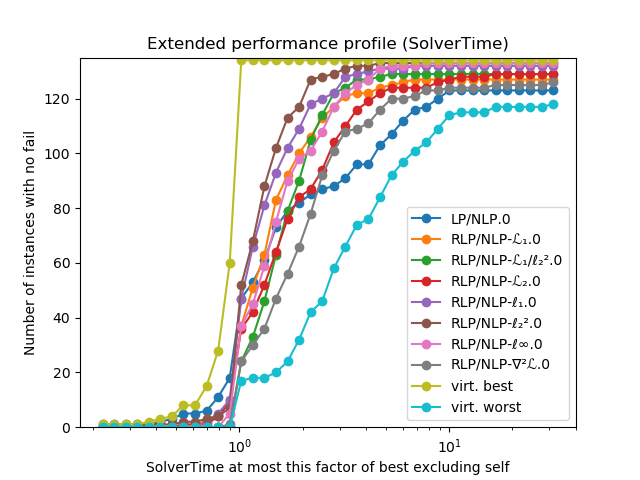
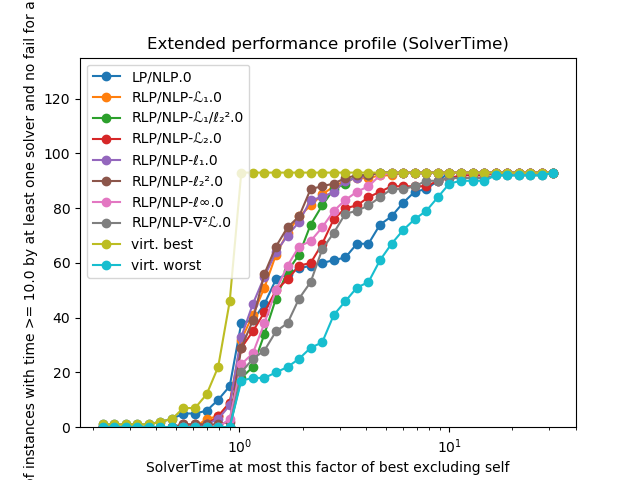
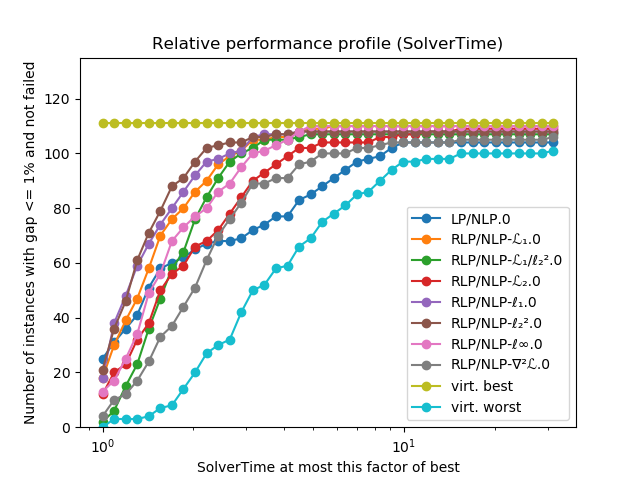
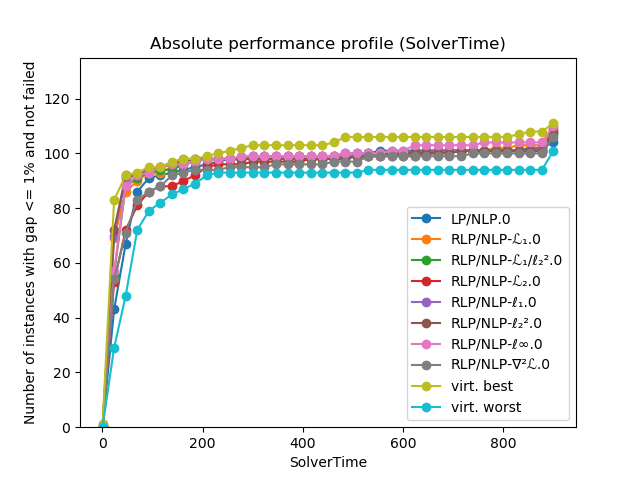
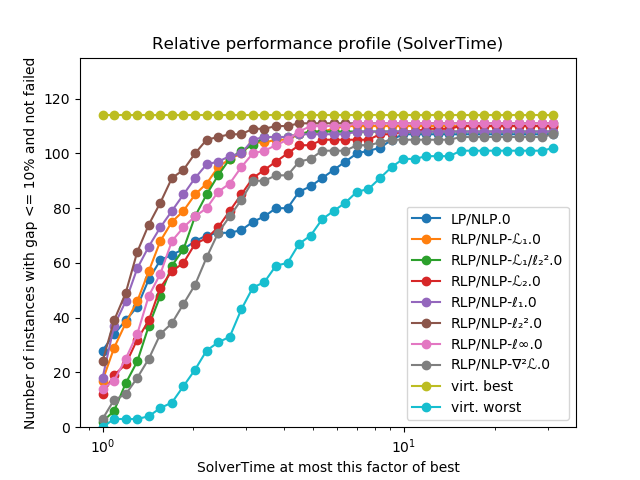
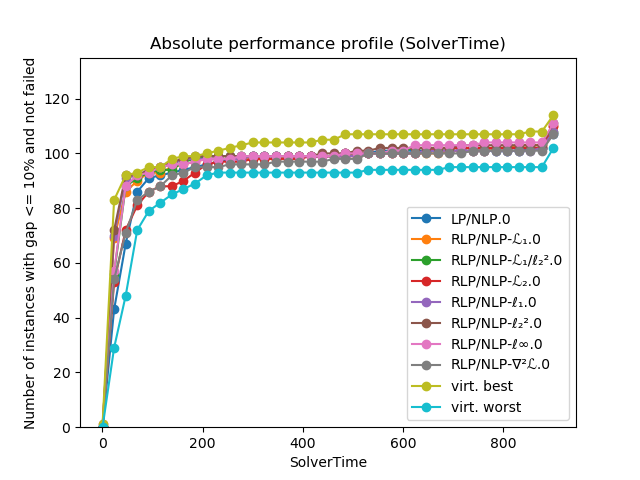
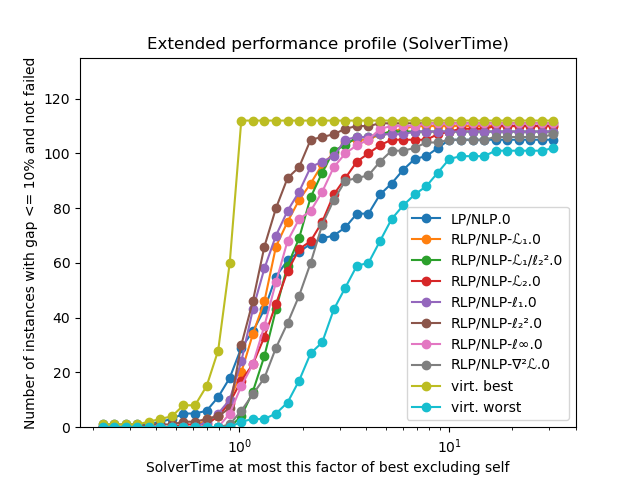
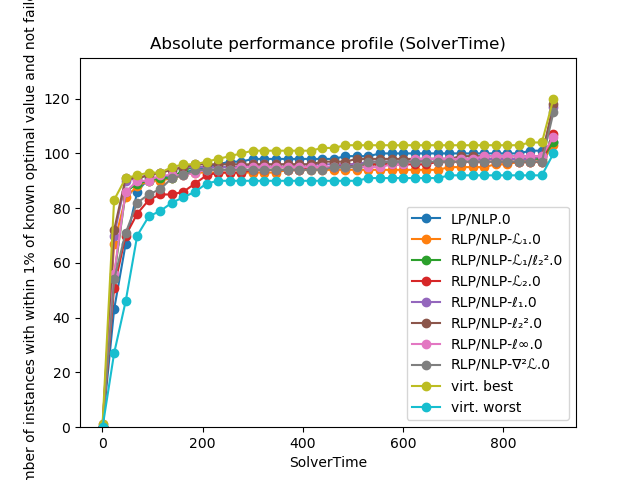
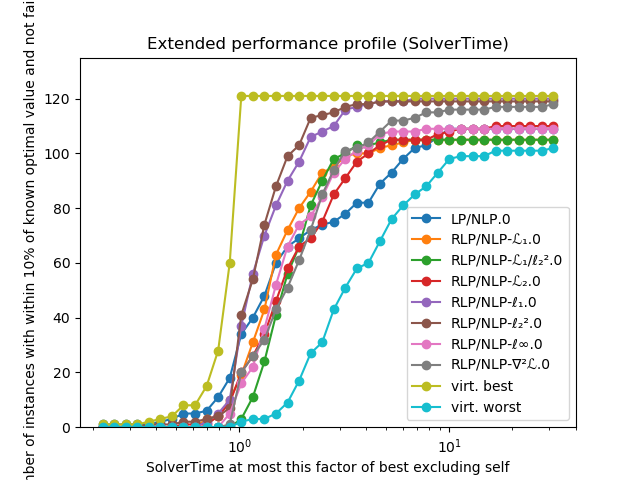
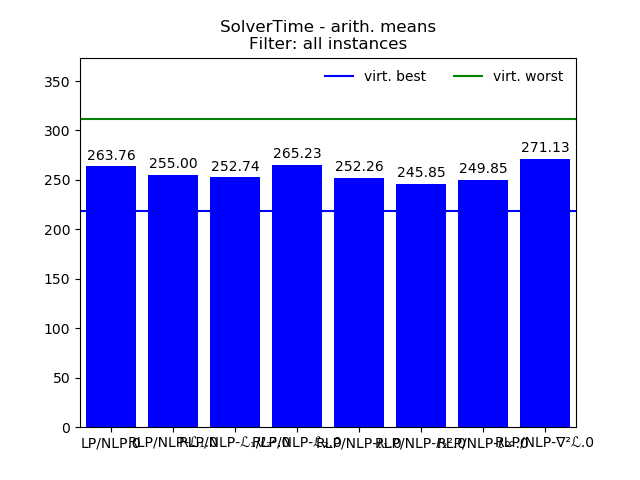
SolverTime
Filter: all instances
Attribute values were projected onto interval [0.1, 900.0].
Missing values and values for failed instances substituted by 900.0 .
| Data | LP/NLP.0 | RLP/NLP-ℒ₁.0 | RLP/NLP-ℒ₁/ℓ₂².0 | RLP/NLP-ℒ₂.0 | RLP/NLP-ℓ₁.0 | RLP/NLP-ℓ₂².0 | RLP/NLP-ℓ∞.0 | RLP/NLP-∇²ℒ.0 | virt. best | virt. worst |
|---|---|---|---|---|---|---|---|---|---|---|
| count | 135.00 | 135.00 | 135.00 | 135.00 | 135.00 | 135.00 | 135.00 | 135.00 | 135.00 | 135.00 |
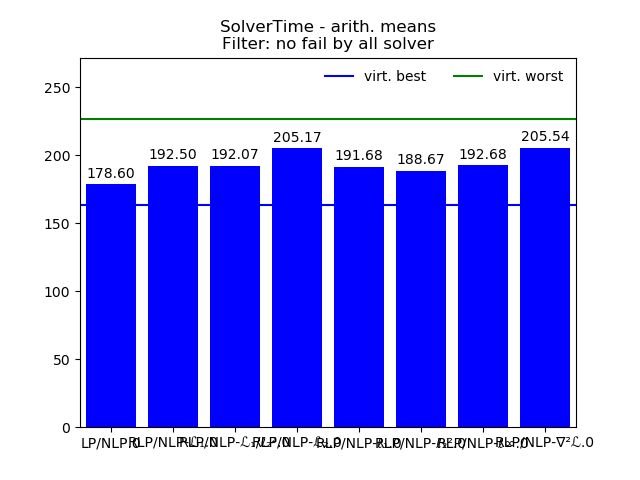
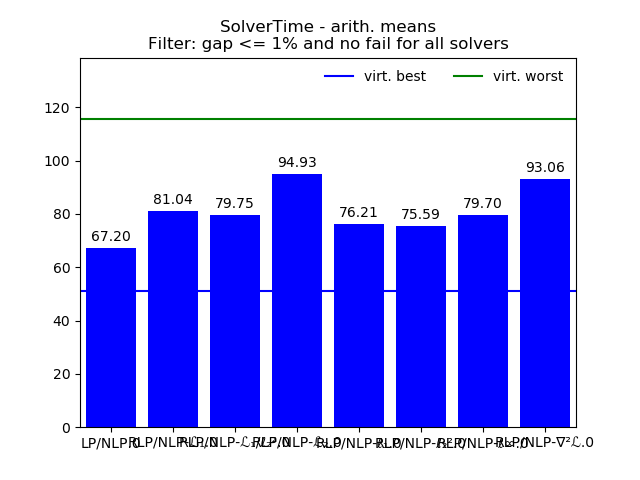
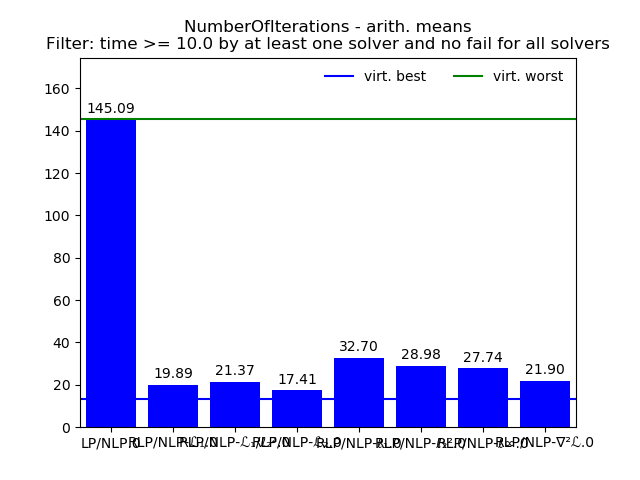
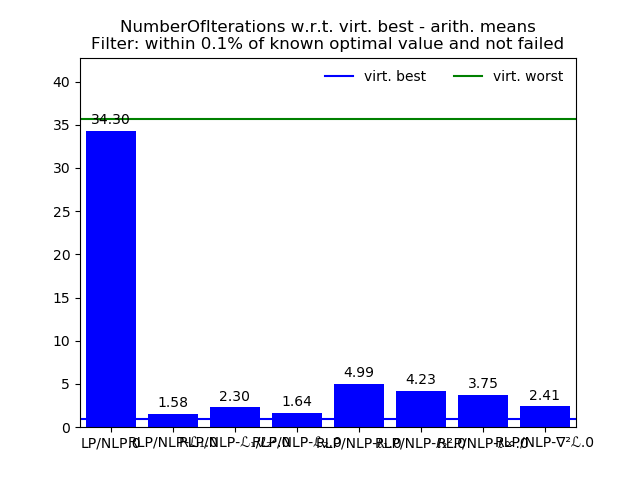
| arith. mean | 263.76 | 255.00 | 252.74 | 265.23 | 252.26 | 245.85 | 249.85 | 271.13 | 218.60 | 311.40 |
| arith. std. | 376.32 | 381.20 | 378.96 | 375.59 | 383.59 | 377.67 | 374.36 | 379.42 | 357.63 | 391.15 |
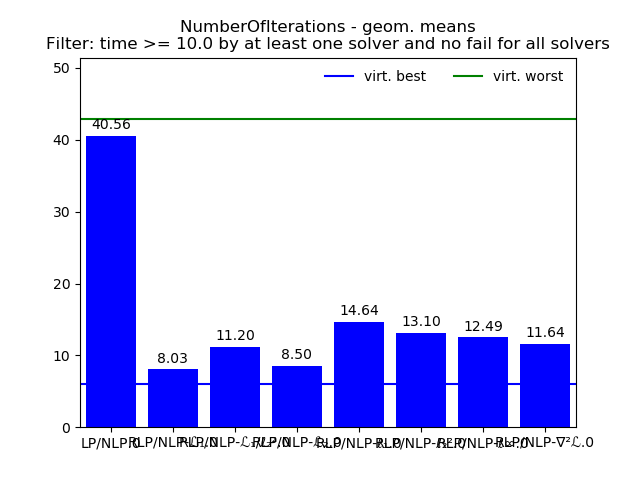
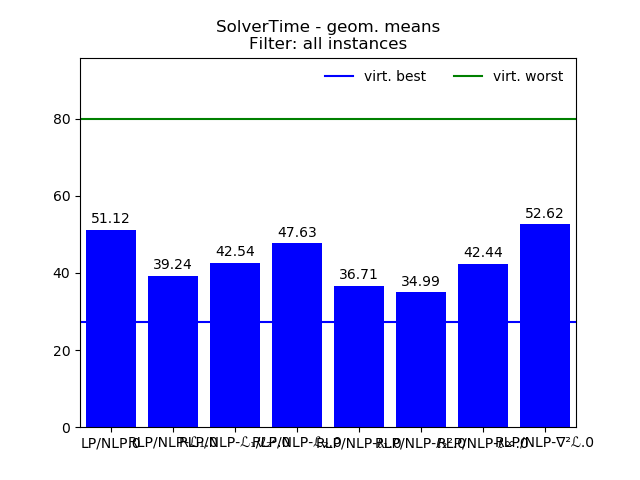
| geom. mean | 51.12 | 39.24 | 42.54 | 47.63 | 36.71 | 34.99 | 42.44 | 52.62 | 27.37 | 79.86 |
| geom. std. | 8.49 | 8.80 | 8.40 | 8.70 | 9.06 | 9.43 | 8.38 | 8.27 | 9.75 | 7.34 |
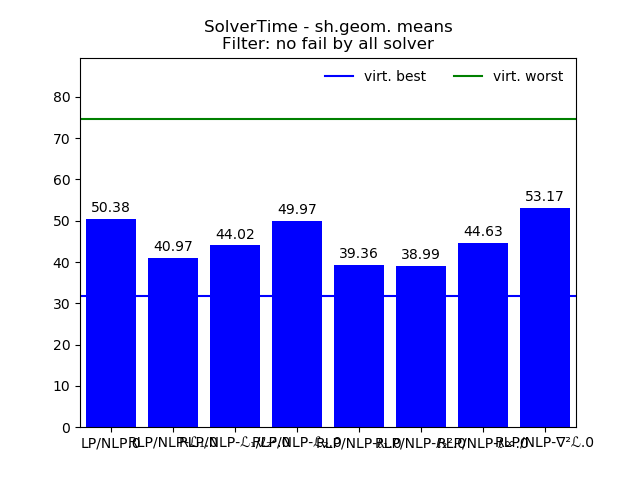
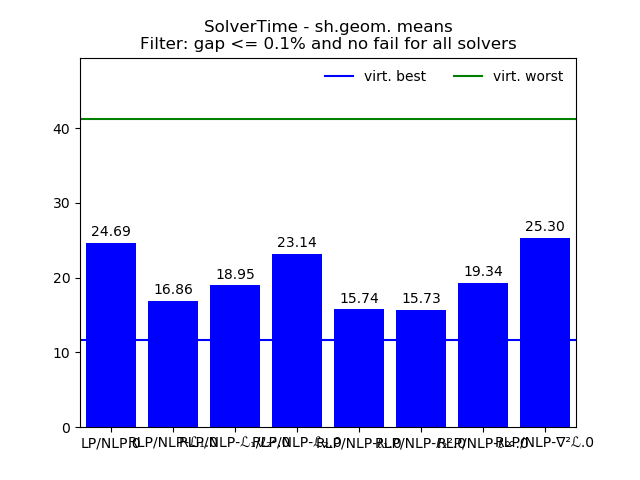
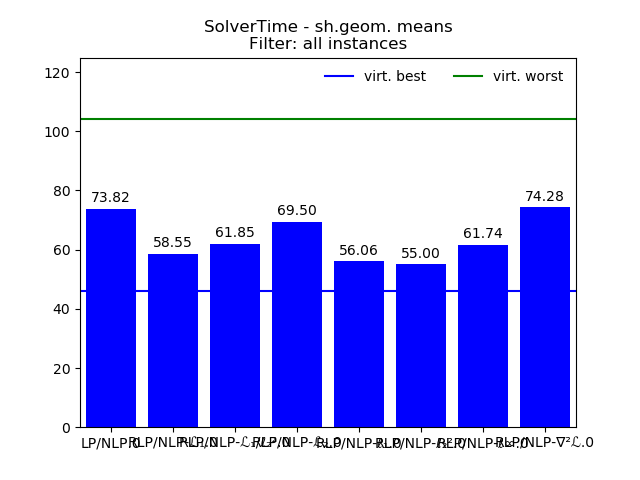
| sh.geom. mean | 73.82 | 58.55 | 61.85 | 69.50 | 56.06 | 55.00 | 61.74 | 74.28 | 45.91 | 104.09 |
| sh.geom. std. | 4.88 | 5.28 | 5.03 | 5.18 | 5.27 | 5.22 | 5.00 | 5.02 | 5.17 | 4.70 |
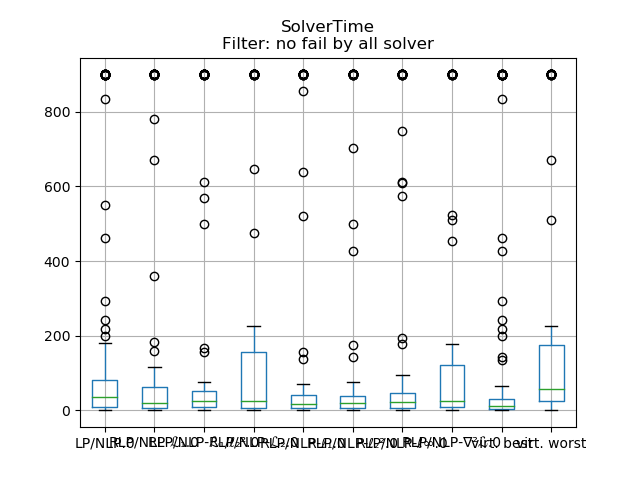
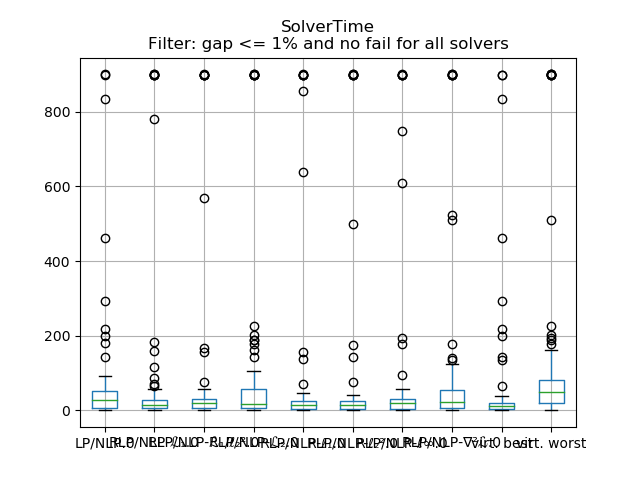
| min | 0.34 | 0.28 | 0.26 | 0.28 | 0.41 | 0.33 | 0.23 | 0.26 | 0.23 | 0.41 |
| 10.0% | 2.50 | 3.40 | 3.13 | 3.36 | 2.18 | 1.89 | 2.99 | 3.26 | 1.58 | 4.52 |
| 25.0% | 15.50 | 8.21 | 13.16 | 7.64 | 11.34 | 10.58 | 14.24 | 15.55 | 6.01 | 27.98 |
| 50.0% | 47.02 | 23.08 | 27.21 | 33.50 | 22.12 | 22.60 | 27.65 | 37.61 | 18.00 | 62.05 |
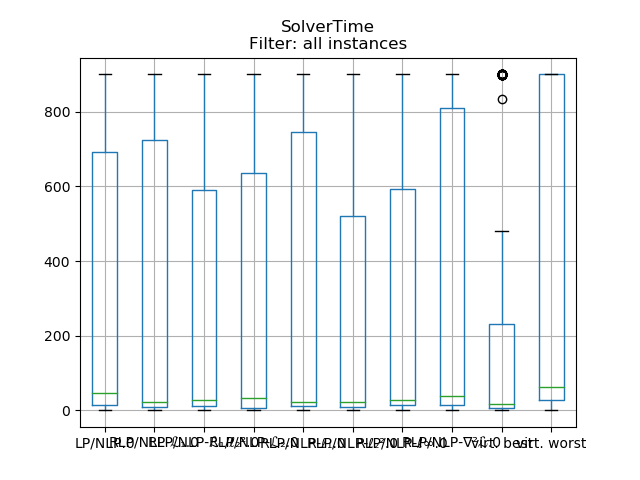
| 75.0% | 692.68 | 725.31 | 589.53 | 636.29 | 746.46 | 520.76 | 592.06 | 809.72 | 230.38 | 900.00 |
| 90.0% | 900.00 | 900.00 | 900.00 | 900.00 | 900.00 | 900.00 | 900.00 | 900.00 | 899.85 | 900.00 |
| max | 900.00 | 900.00 | 900.00 | 900.00 | 900.00 | 900.00 | 900.00 | 900.00 | 900.00 | 900.00 |
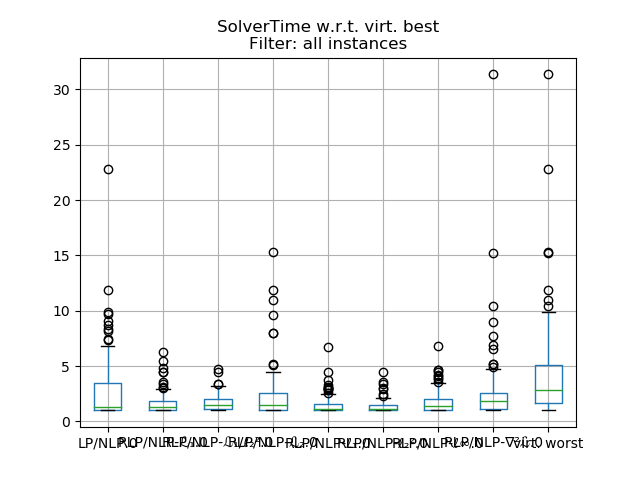
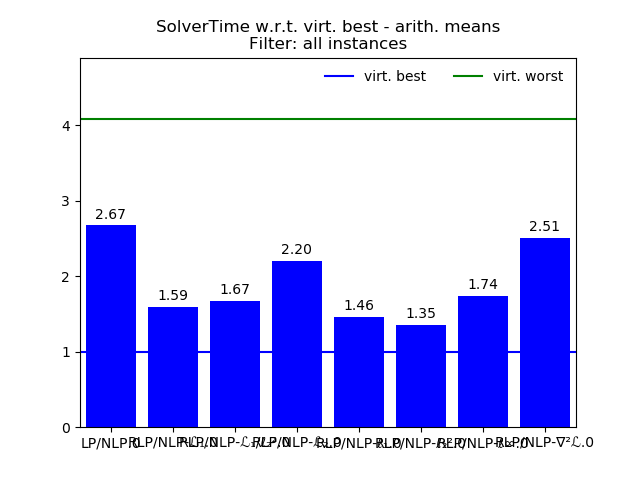
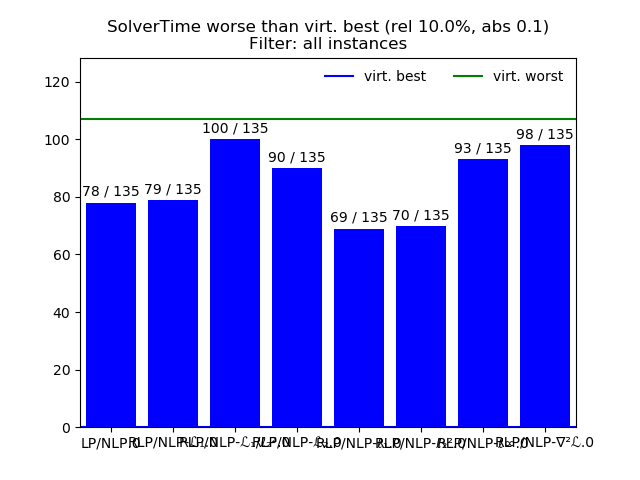
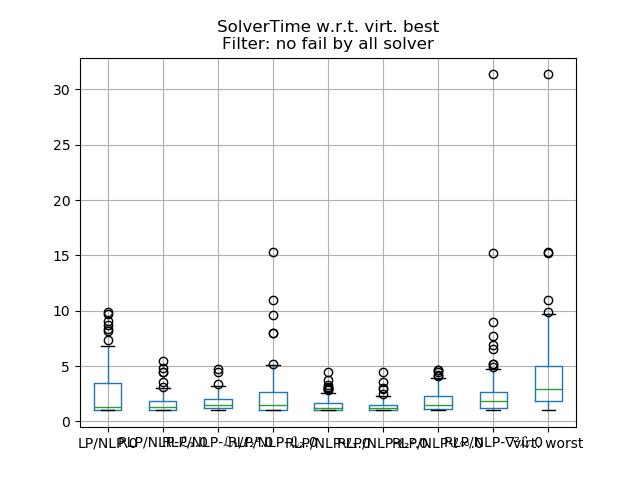
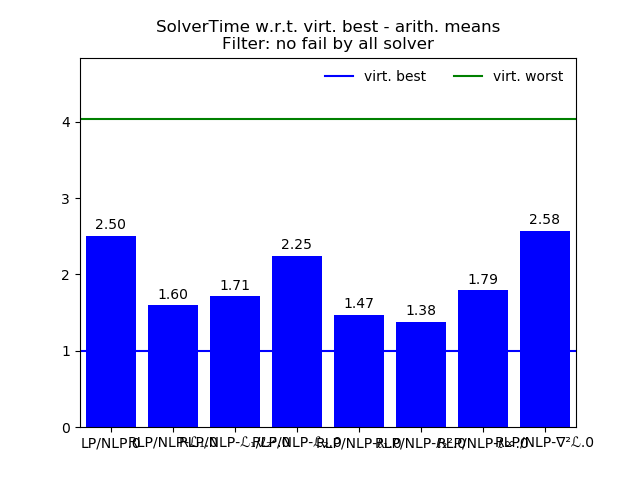
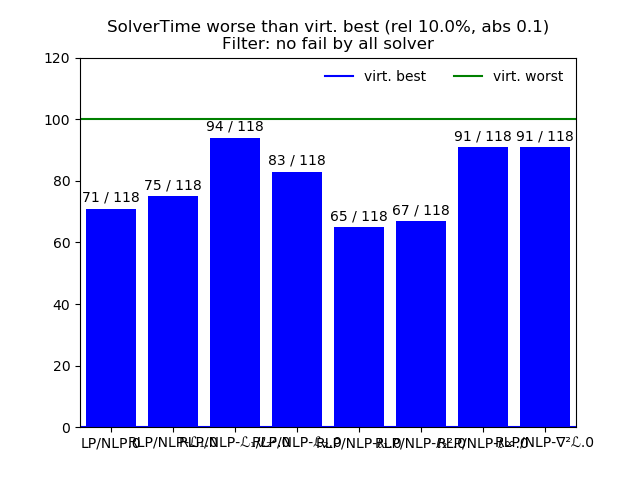
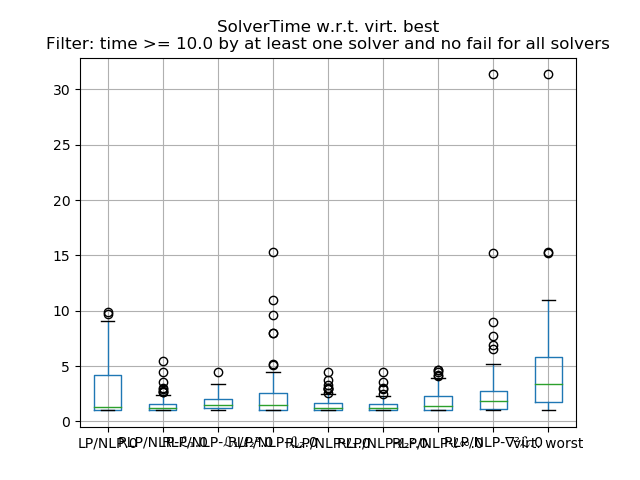
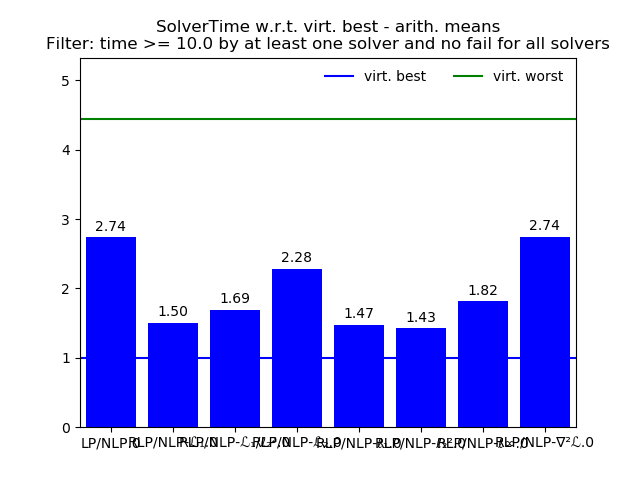
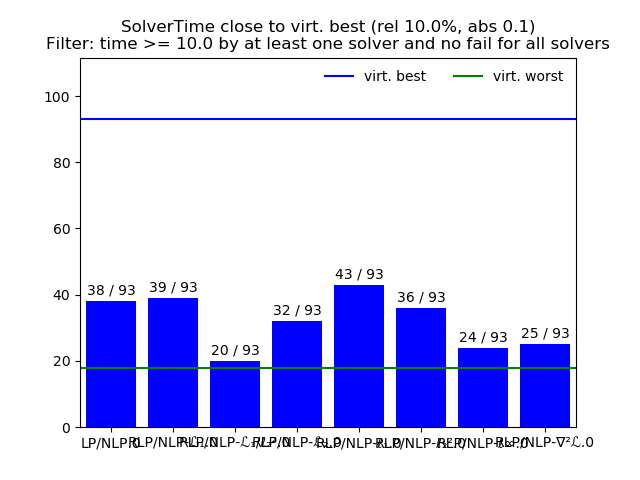
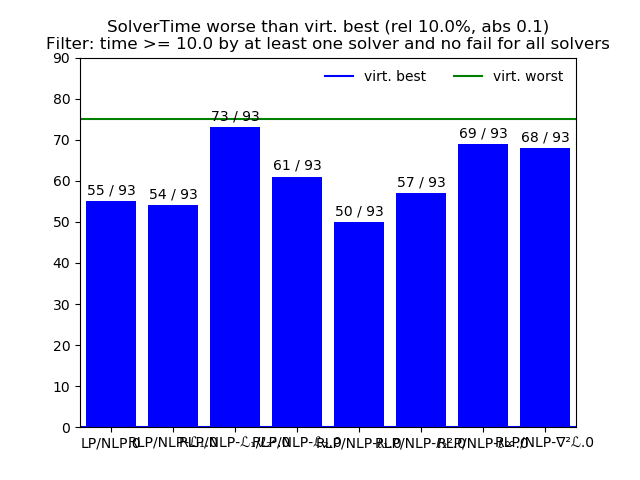
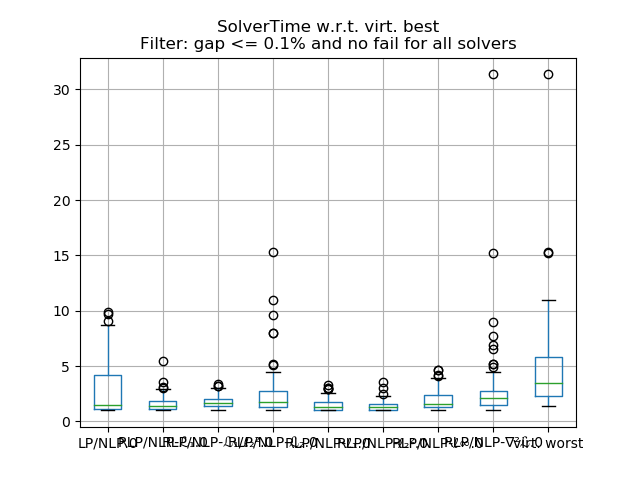
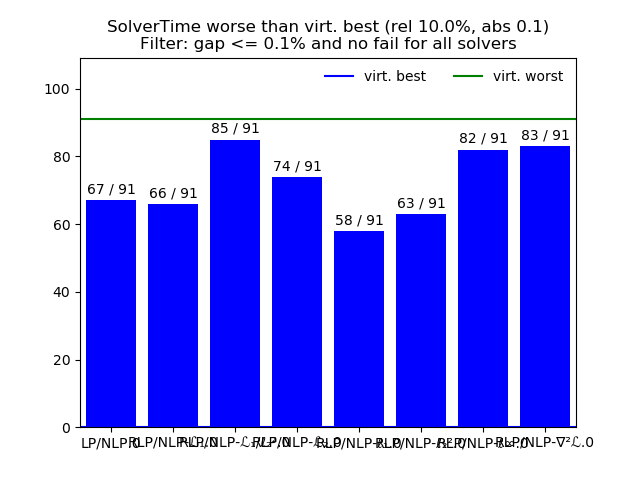
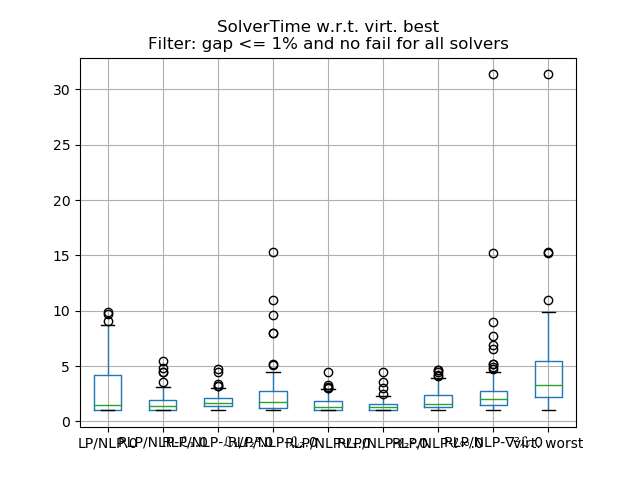
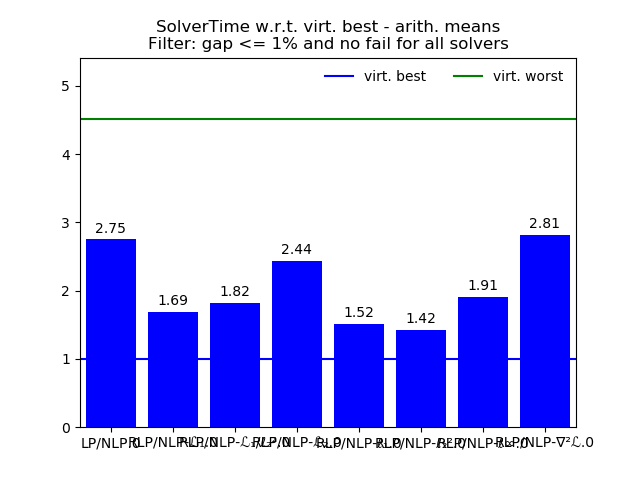
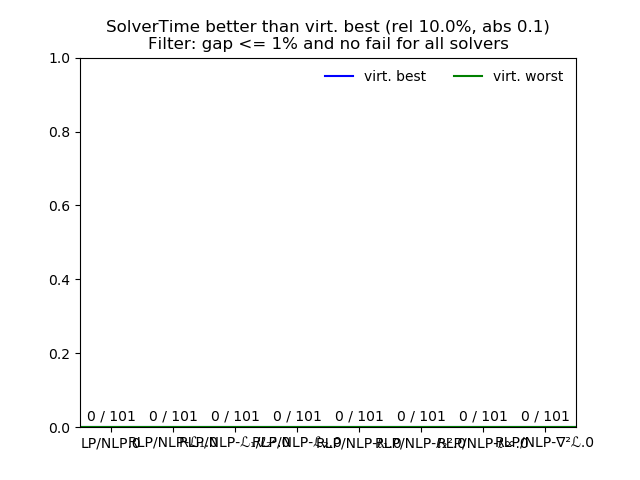
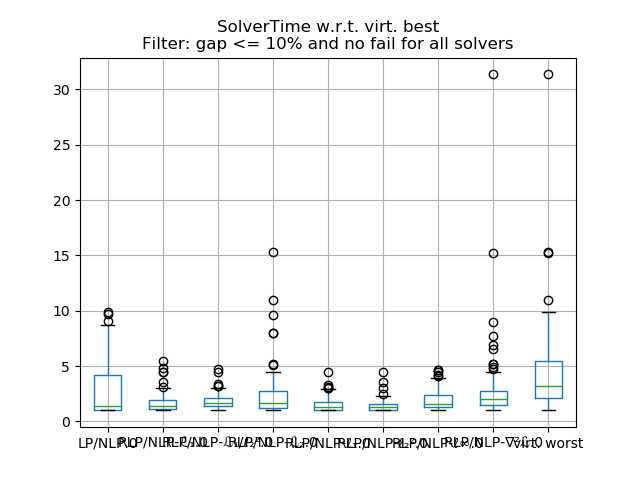
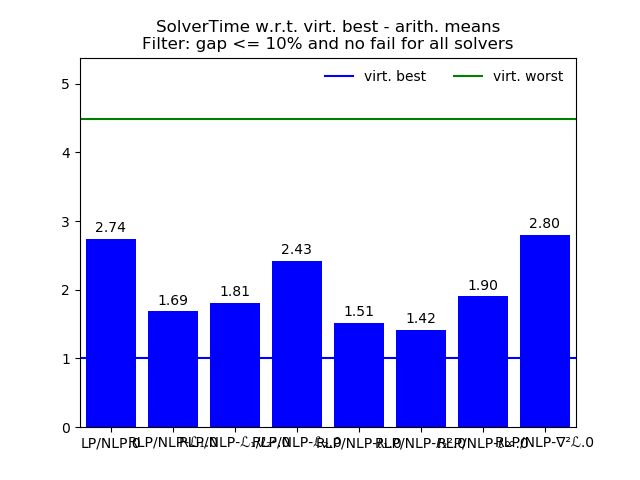
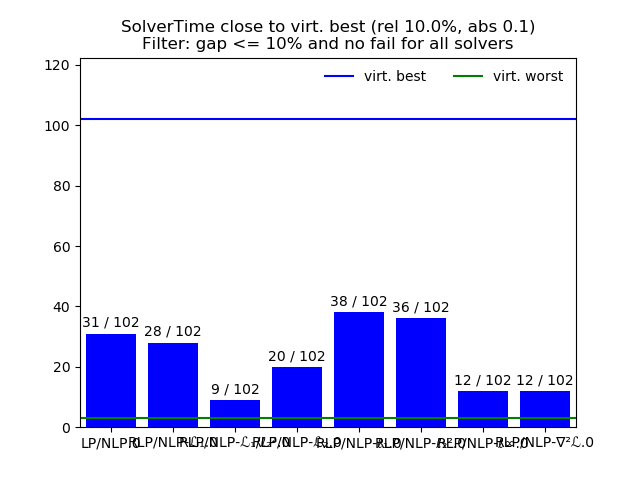
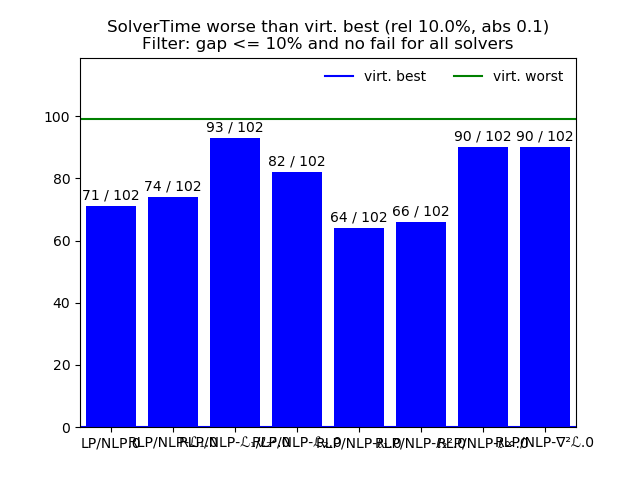
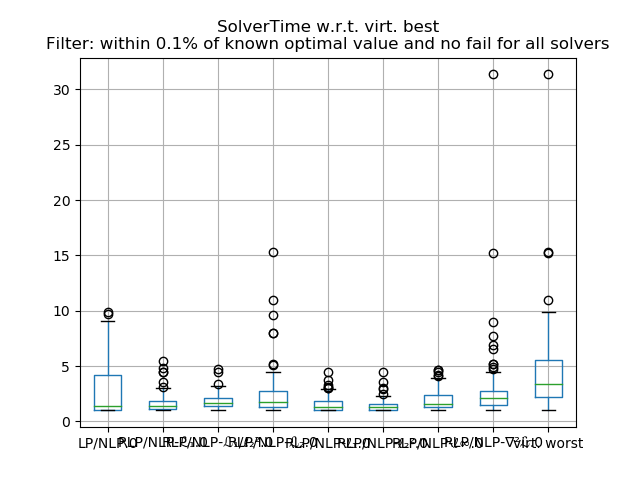
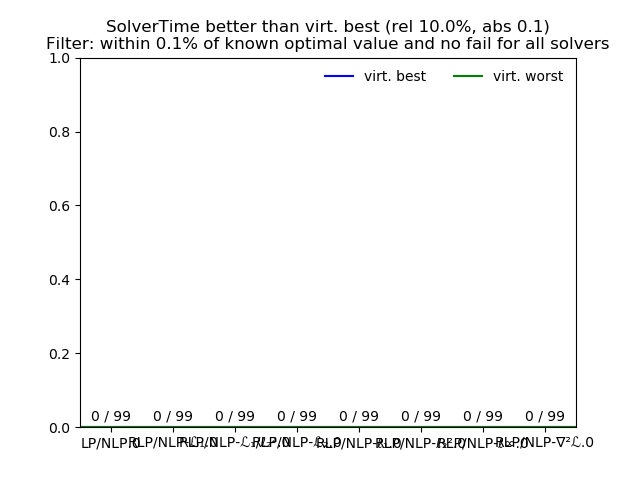
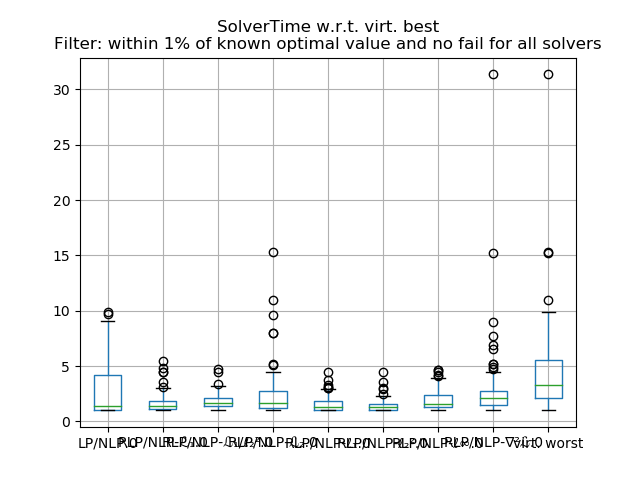
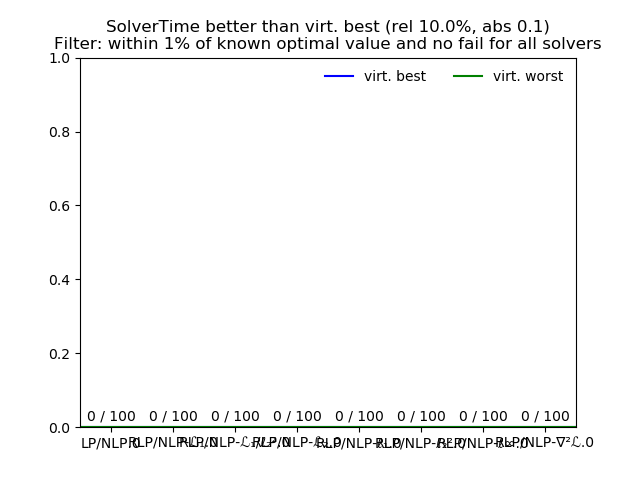
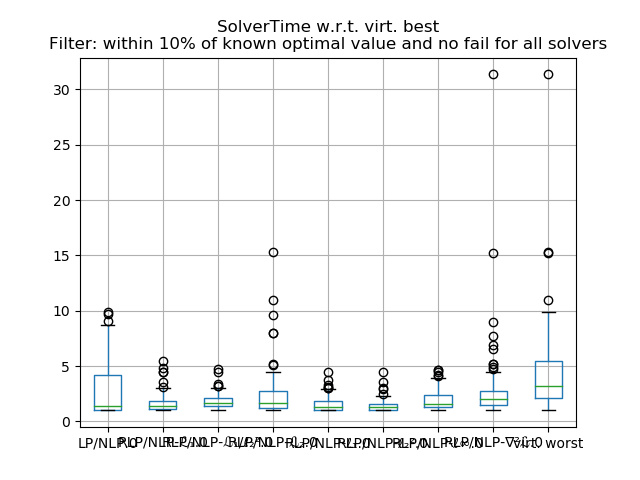
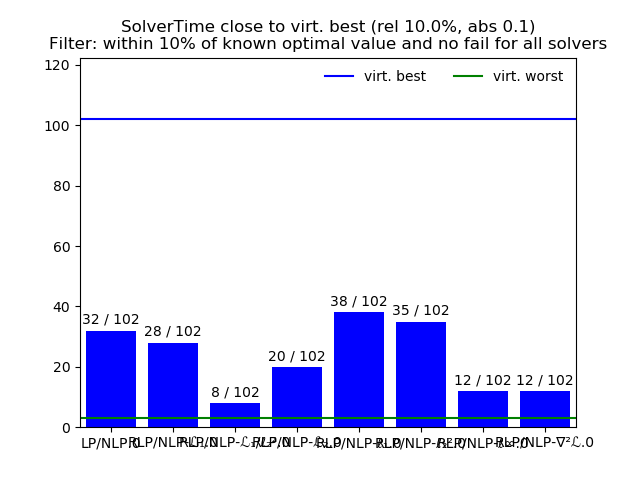
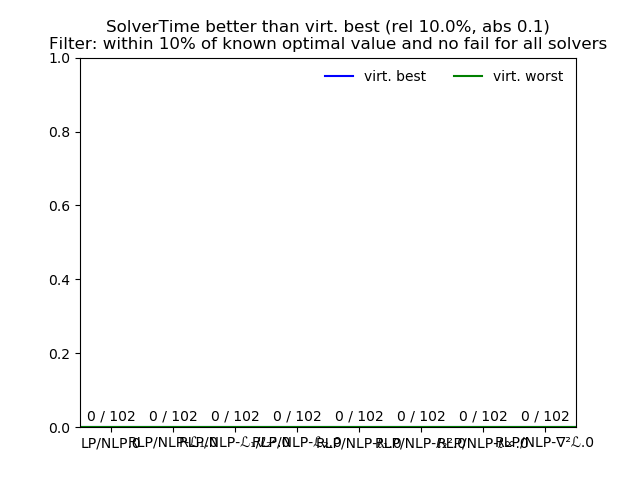
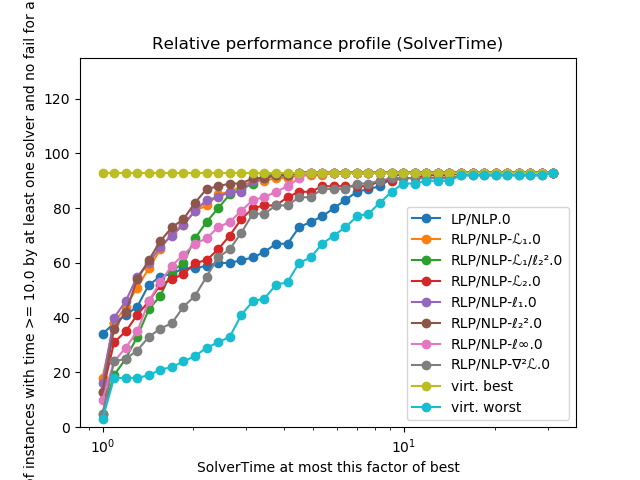
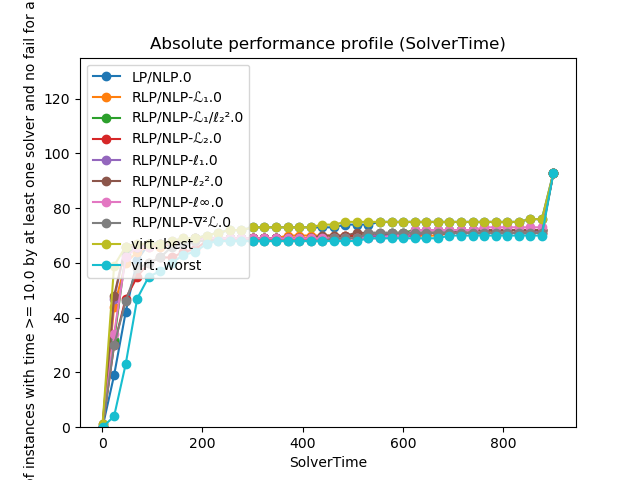
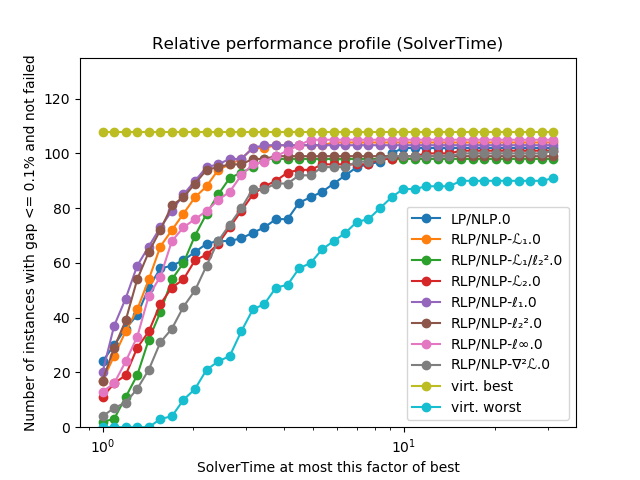
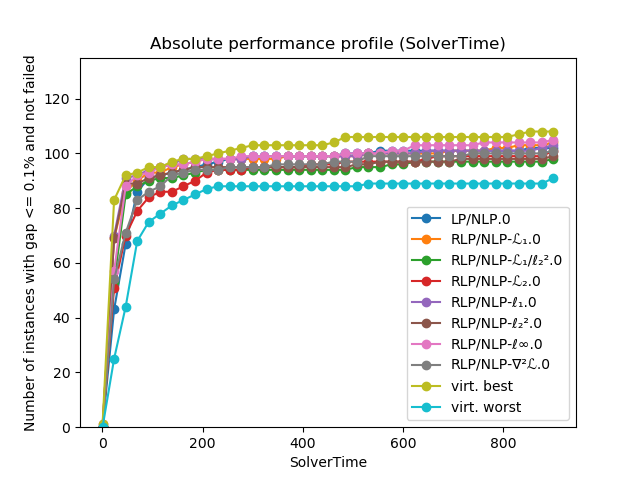
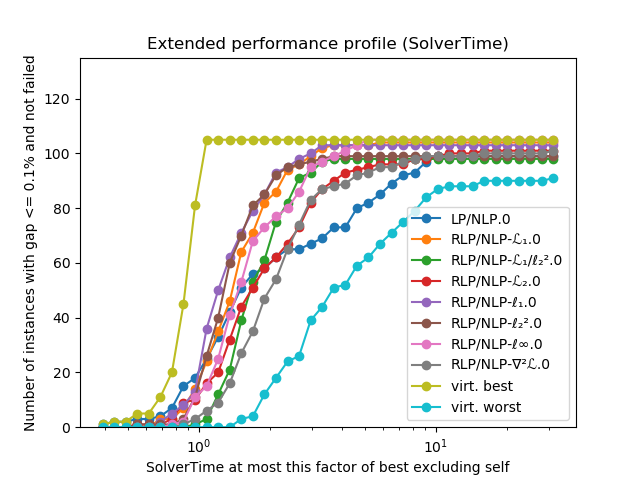
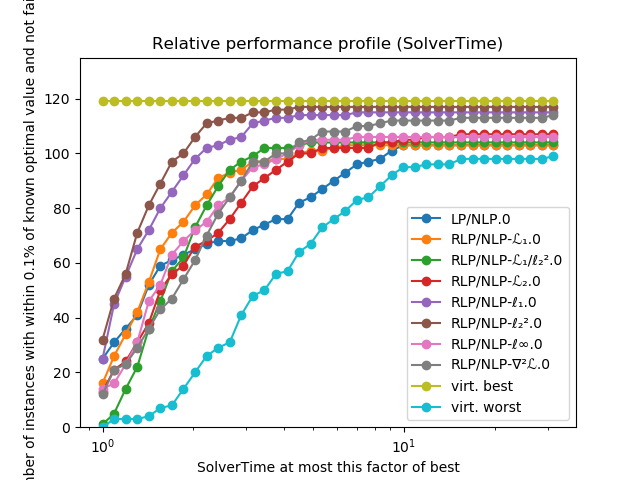
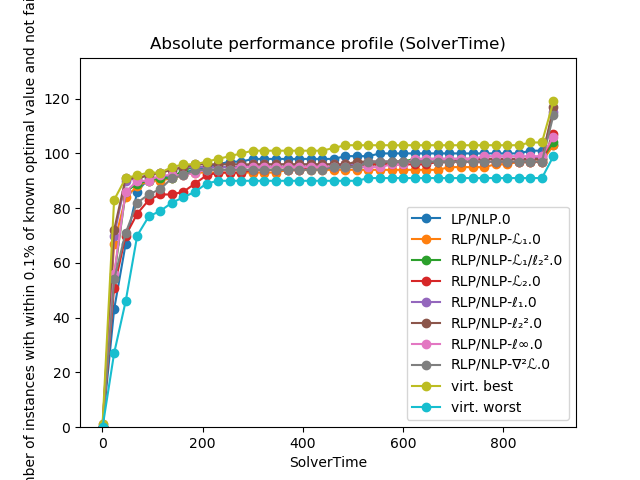
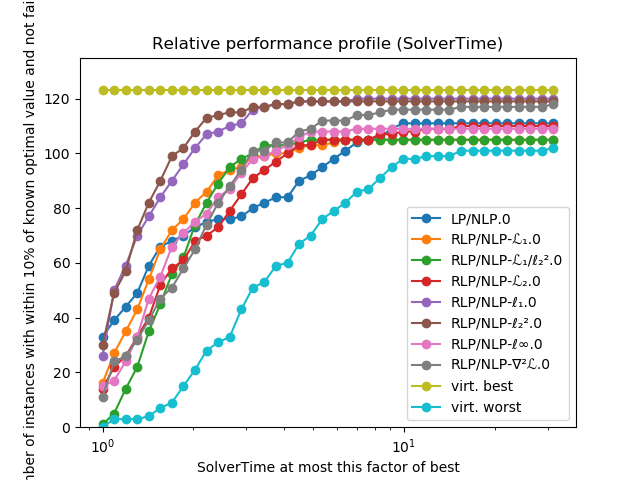
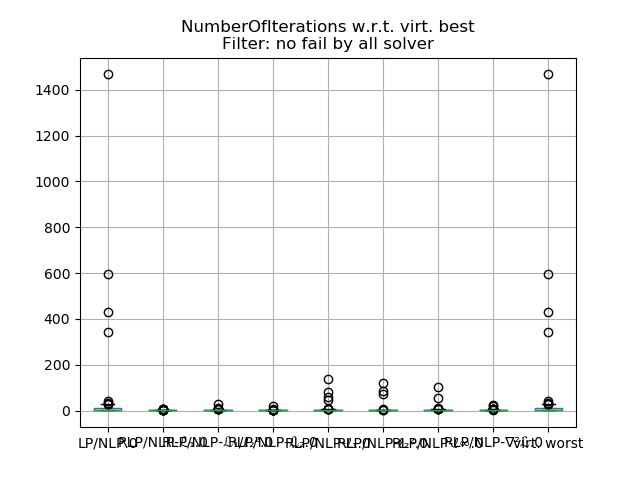
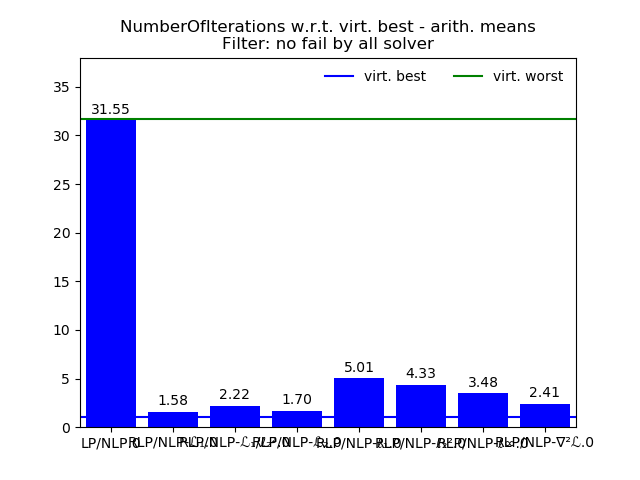
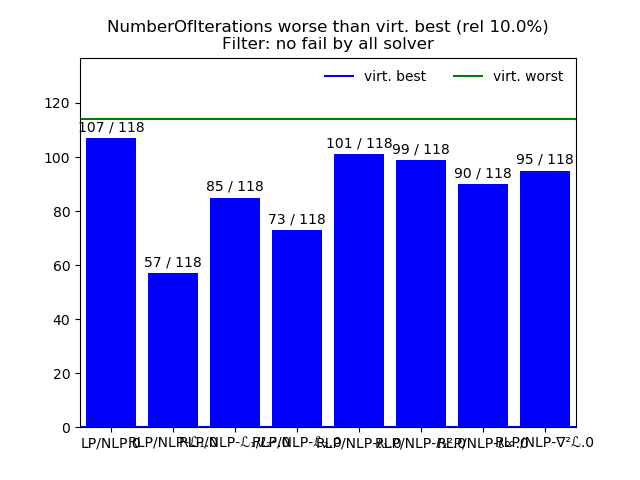
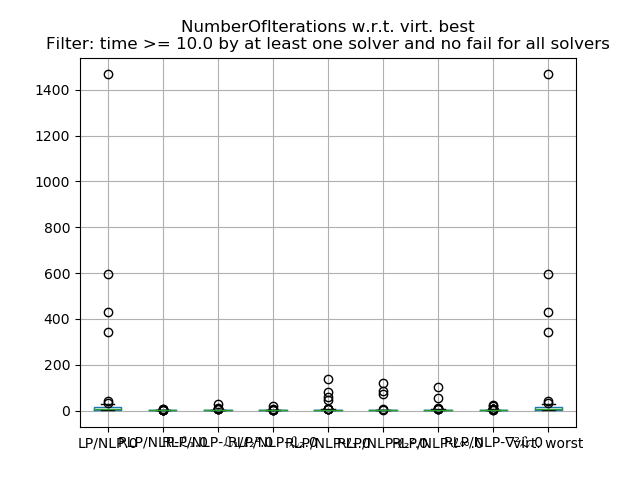
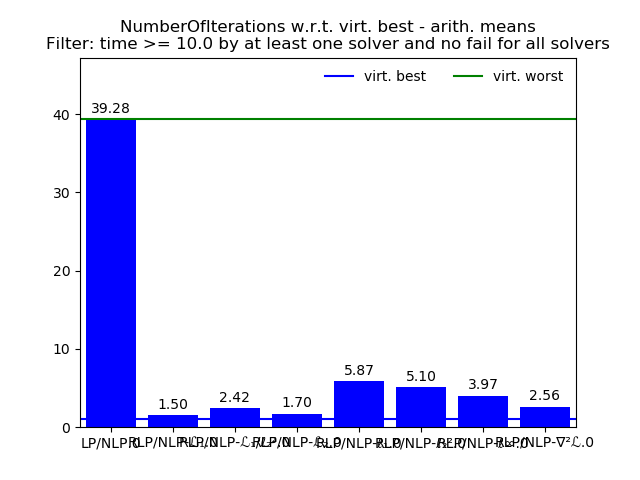
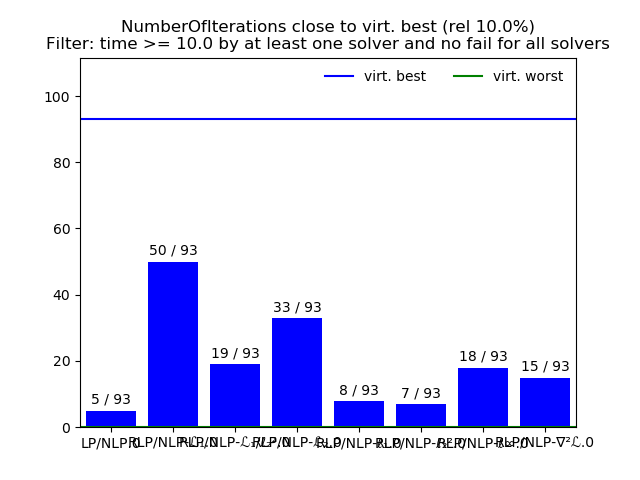
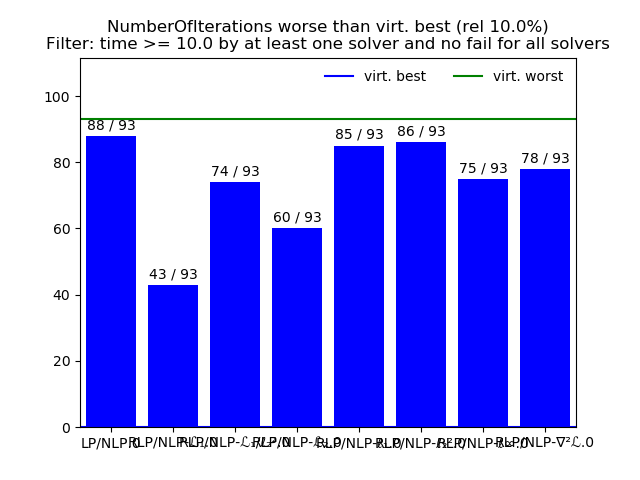
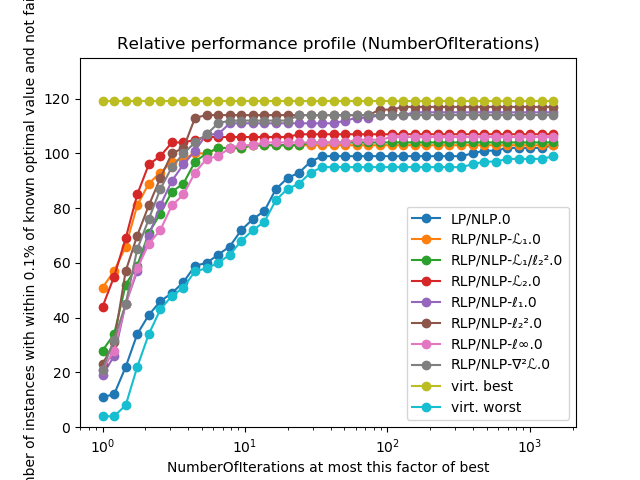
Performance with respect to virt. best:
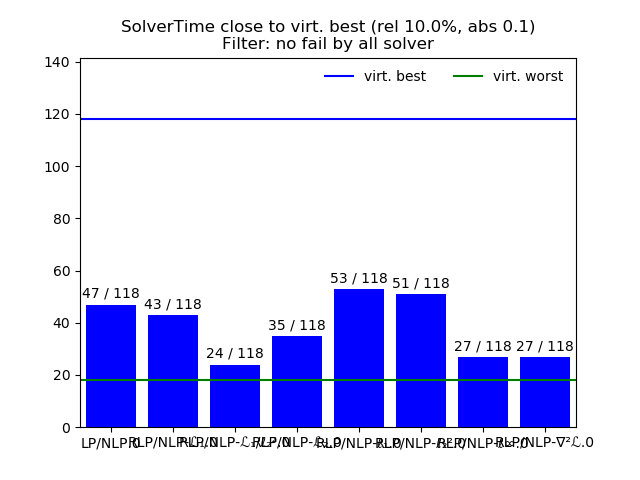
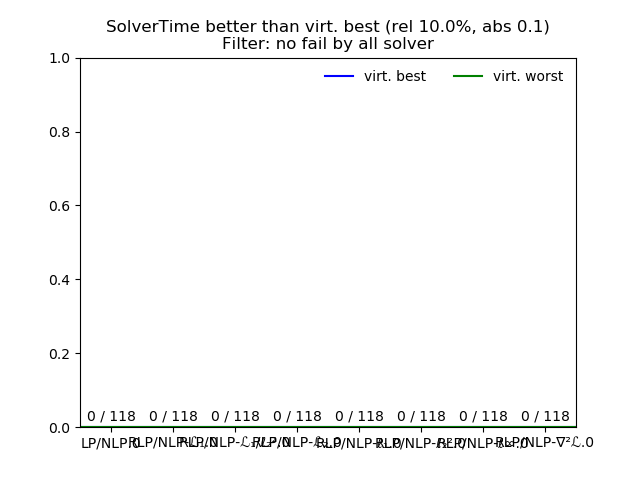
Tolerance:
relative 0.1
absolute 0.1
| Data | LP/NLP.0 | RLP/NLP-ℒ₁.0 | RLP/NLP-ℒ₁/ℓ₂².0 | RLP/NLP-ℒ₂.0 | RLP/NLP-ℓ₁.0 | RLP/NLP-ℓ₂².0 | RLP/NLP-ℓ∞.0 | RLP/NLP-∇²ℒ.0 | virt. worst |
|---|---|---|---|---|---|---|---|---|---|
| count | 135.00 | 135.00 | 135.00 | 135.00 | 135.00 | 135.00 | 135.00 | 135.00 | 135.00 |
| arith. mean | 2.67 | 1.59 | 1.67 | 2.20 | 1.46 | 1.35 | 1.74 | 2.51 | 4.08 |
| arith. std. | 2.94 | 0.91 | 0.70 | 2.14 | 0.78 | 0.55 | 0.98 | 3.15 | 4.11 |
| min | 1.00 | 1.00 | 1.00 | 1.00 | 1.00 | 1.00 | 1.00 | 1.00 | 1.00 |
| 10.0% | 1.00 | 1.00 | 1.00 | 1.00 | 1.00 | 1.00 | 1.00 | 1.00 | 1.00 |
| 25.0% | 1.00 | 1.00 | 1.11 | 1.00 | 1.00 | 1.00 | 1.00 | 1.08 | 1.66 |
| 50.0% | 1.33 | 1.29 | 1.49 | 1.48 | 1.16 | 1.15 | 1.38 | 1.82 | 2.80 |
| 75.0% | 3.48 | 1.81 | 1.99 | 2.54 | 1.62 | 1.47 | 2.02 | 2.61 | 5.12 |
| 90.0% | 6.38 | 2.60 | 2.53 | 3.74 | 2.18 | 2.01 | 2.94 | 4.33 | 8.30 |
| max | 22.78 | 6.29 | 4.72 | 15.30 | 6.75 | 4.49 | 6.85 | 31.35 | 31.35 |
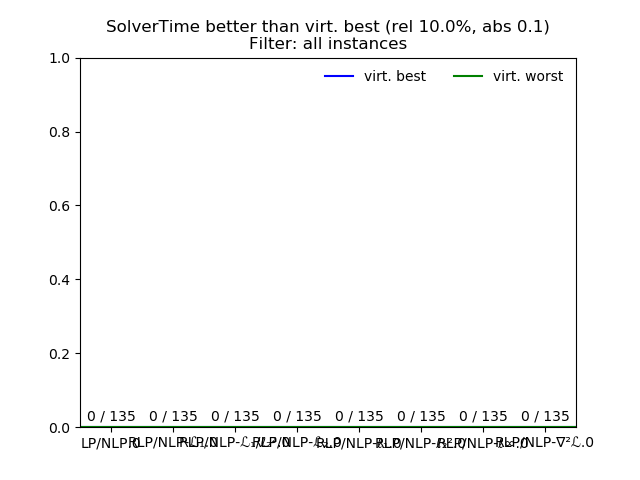
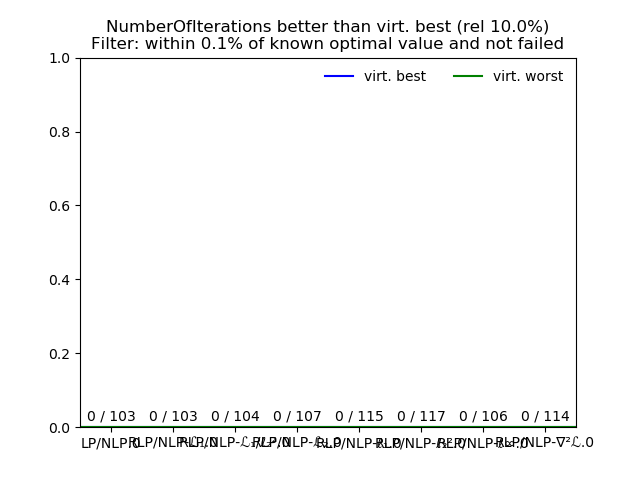
| better | 0.00 | 0.00 | 0.00 | 0.00 | 0.00 | 0.00 | 0.00 | 0.00 | 0.00 |
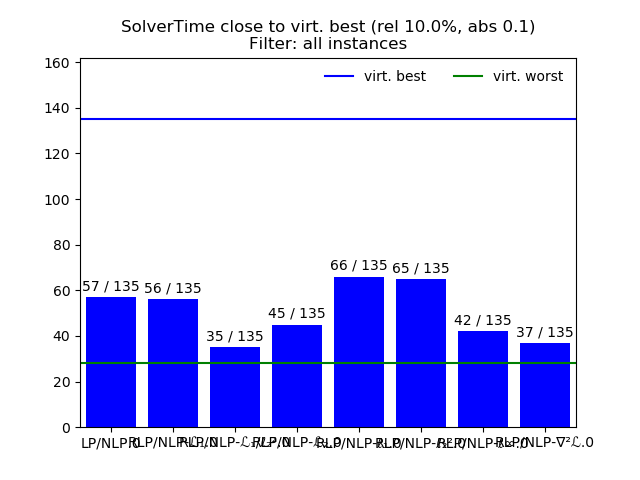
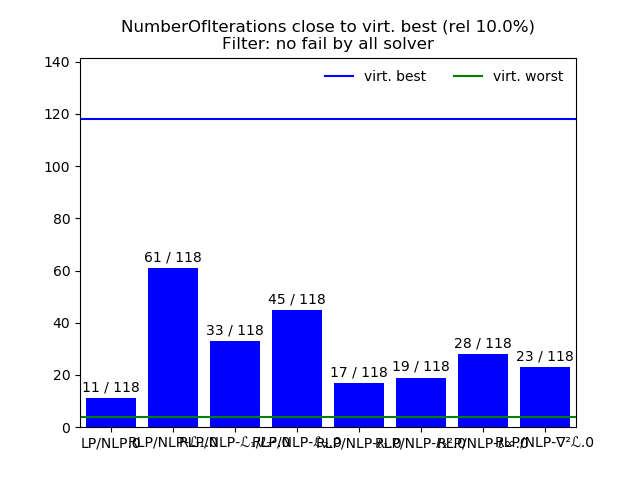
| close | 57.00 | 56.00 | 35.00 | 45.00 | 66.00 | 65.00 | 42.00 | 37.00 | 28.00 |
| worse | 78.00 | 79.00 | 100.00 | 90.00 | 69.00 | 70.00 | 93.00 | 98.00 | 107.00 |